

📈📉 +100% Gains! Still Time To 2x on THIS Altcoin Trade!
📈📉 +100% Gains! Still Time To 2x on THIS Altcoin Trade!
PLUS: TOTAL Testing a CRUCIAL Level!
Overview
Chart #1 - Gala (GALAUSDT) 8-Hour
Chart #2 - SingularityNET (AGIXUSDT) Daily
Chart #3 - Avalanche (AVAXUSDT) Weekly
Chart #4 - Crypto Total Market Cap (TOTAL) Weekly
Chart #5 - Fear and Greed Index
Chart #1 - Gala (GALAUSDT) 8-Hour
Chartist: Sheldon
(For the chart screenshot, click here.)
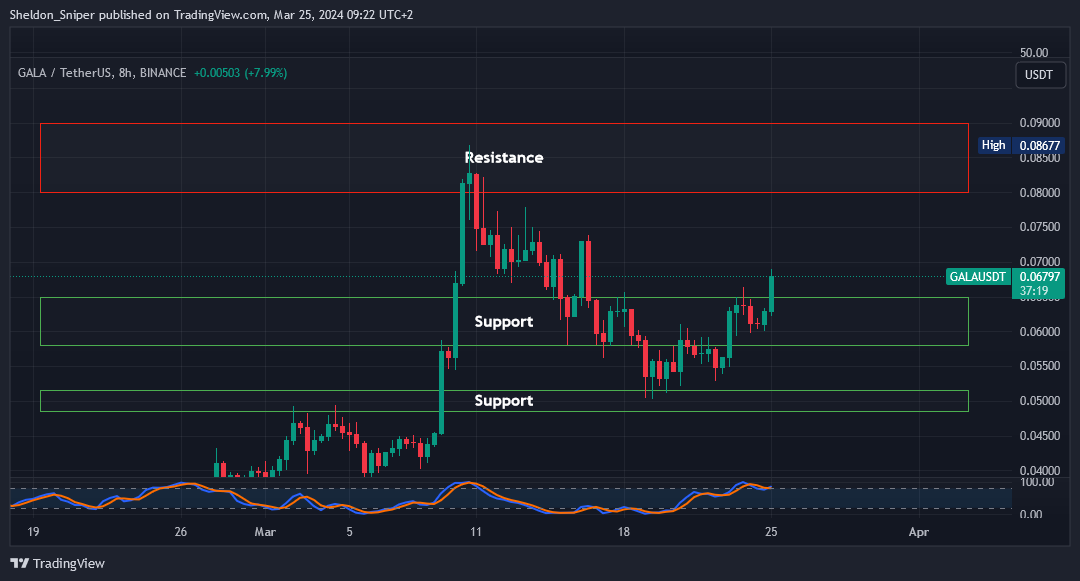
GALA has been very bullish over the last couple of days.
If there is a market pullback, it could create an opportunity for a spot-long trade. The TOTAL is currently at resistance, so I would wait a day or two to see if there is a pullback to buy at lower levels. We can get set up now on Bybit.
Entry: In the current area of support at $0.058 - $0.065
TP1: $0.08 - $0.09
TP2: $0.14 - $0.16 (not shown on chart)
Stop Loss: Just below $0.057. I’ll have a tighter stop loss on this trade, just in case the market has a deeper retrace.
Chart #2 - SingularityNET (AGIXUSDT) Daily
Chartist: Kyle
(For the chart screenshot, click here.)
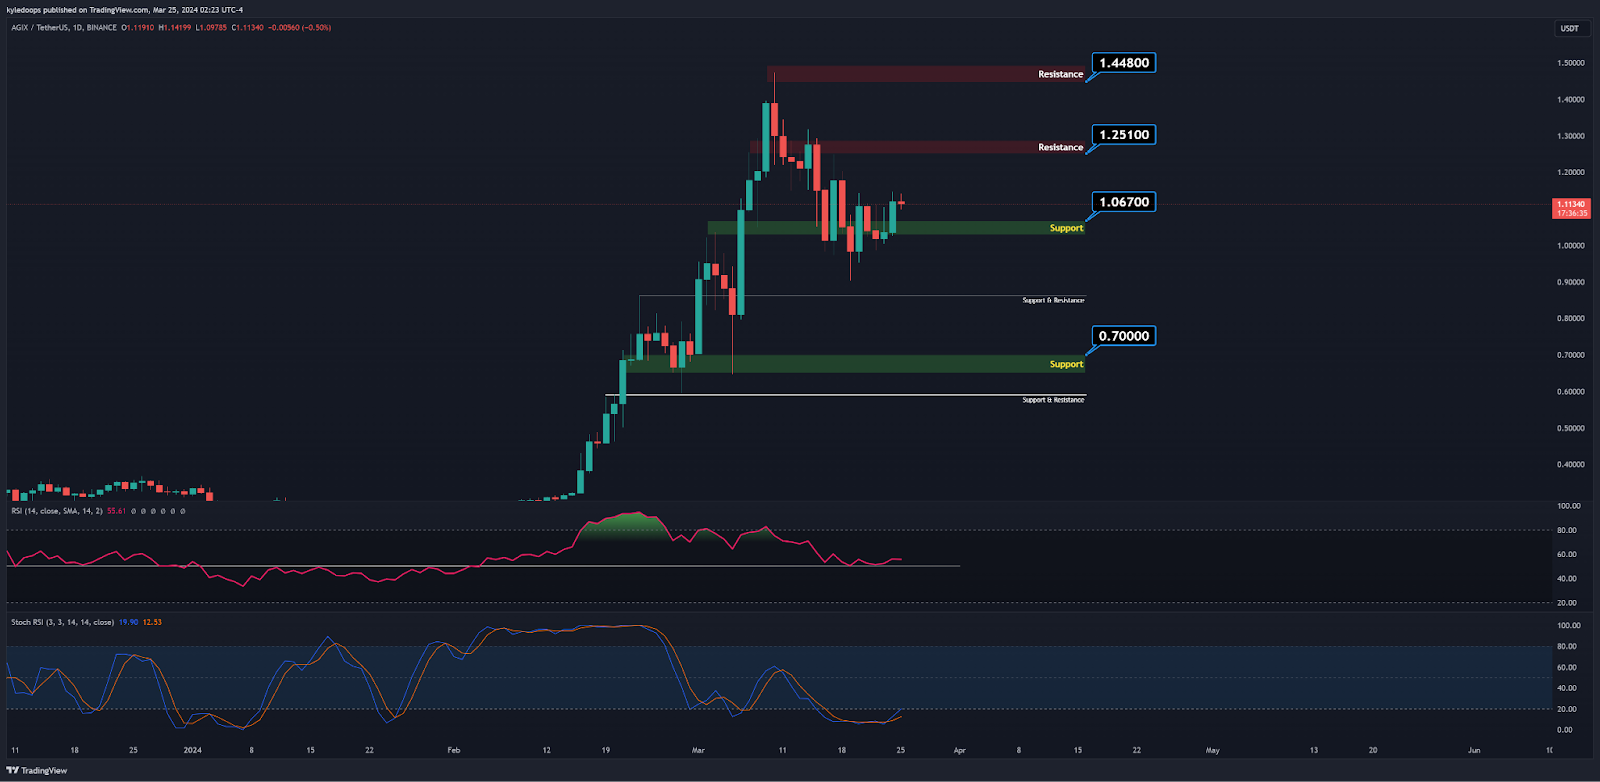
AGIX found support at $1.067 and is currently at $1.112, correcting and giving us a long trade opportunity to take on Bitget.
Entry: Between $1.11 and $1.067
TP1: $1.251
TP2: $1.448
Stop Loss: $0.987

Outsmart 99% Of The Market!
Get full access to our Discord And Telegram group, where you'll find all of our premium content!
👉 Trade Signals!
👉 Trade Set-Ups!
👉 Trading Challenges!
👉 Education!
👉 SO MUCH MORE!
Chart #3 - Avalanche (AVAXUSDT) Weekly
Chartist: Kyle

(For the chart screenshot, click here.)
After bouncing off support at $50, AVAX is trading at $56. This could nearly double from entry to our final Take Profit (TP) level. We’ll quickly get set up on Bitget since it already moved up a lot since bouncing.
Entry: $53 - $56
TP1: $68
TP2: $80
TP3: $100
Stop Loss: $46
Chart #4 - Crypto Total Market Cap (TOTAL) Weekly
Chartist: Sheldon
(For the chart screenshot, click here.)
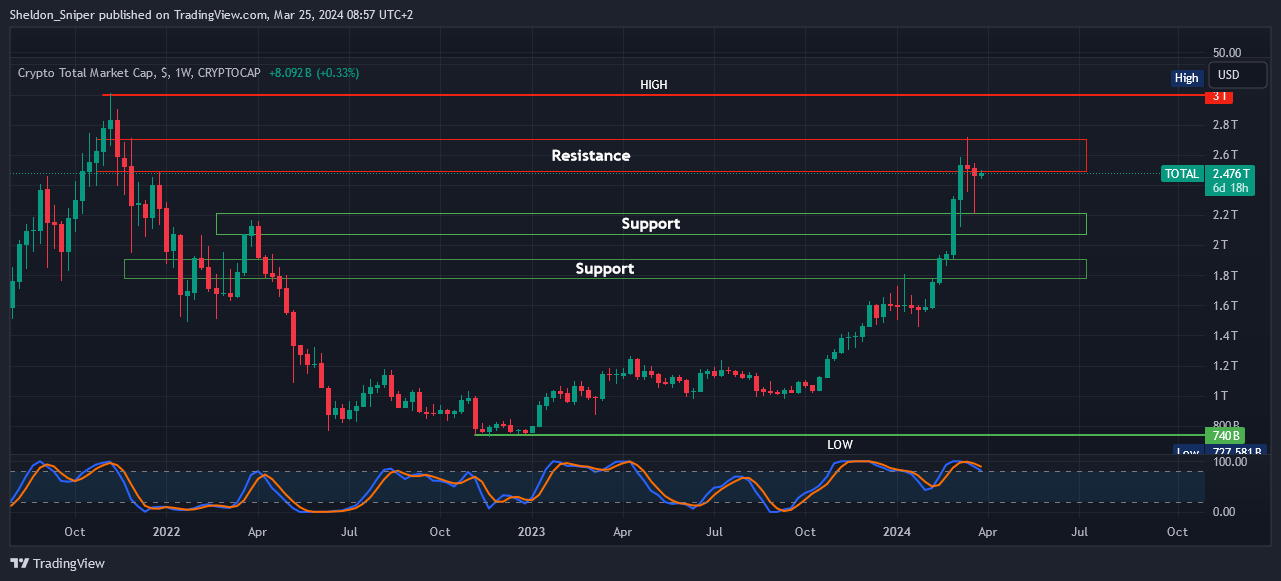
Two weeks ago the TOTAL got rejected at $2.7T and then retraced down to last week’s low of $2.2T. It then found support and moved up again.
It is currently testing the bottom of the range level of resistance at $2.5T, so we need to be careful guys. If it gets rejected here, it will head lower. There is a lot of support between $1.8T and $2.2T that the TOTAL could go and test.
Claim your Bitget sign-up bonuses here (details below).
Chart #5 - Fear and Greed Index
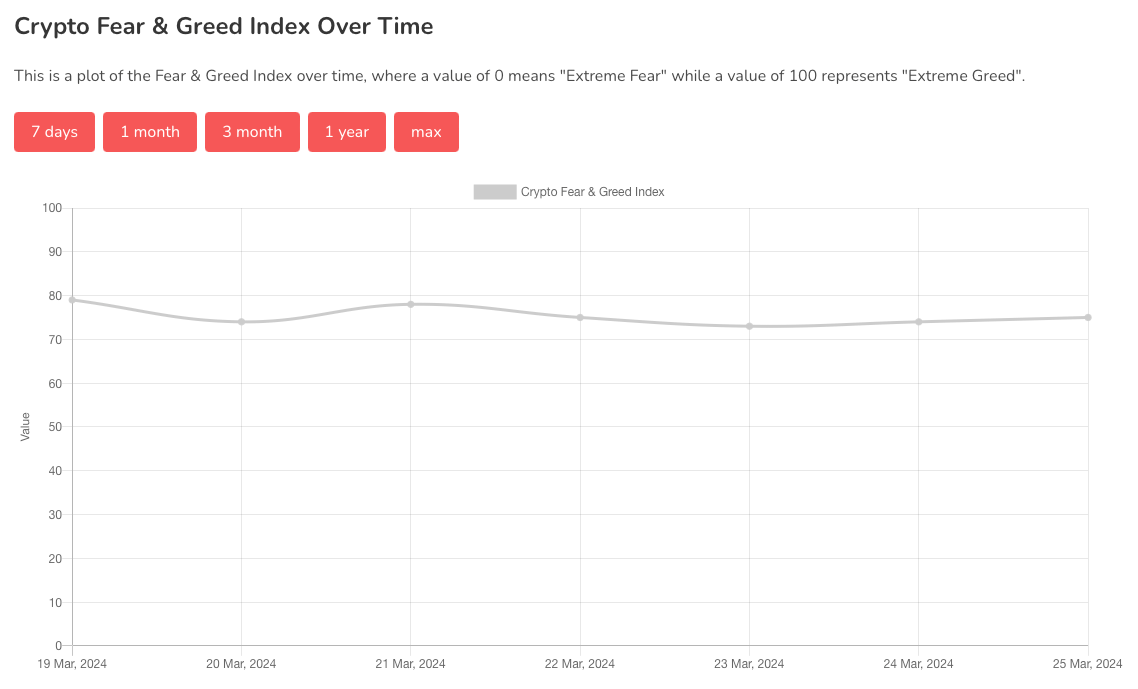
The Fear and Greed Index is sitting at 75 today, indicating Greed.
The highest the index has been over the past seven days is 79, and the lowest is 73.
Banter’s Take
Bitcoin has found a rejection level at $67,500 and is currently testing $66,800 as a level of support. If it holds that level, we can look for a further move to the upside, targeting $69,000, where alts will use this opportunity to rally. If it fails to hold, we may see a drop all the way down to $64,500 or $64,000, where support has been tested before and the market will grab all the profits that were given in the past few days.
It's probably not a bad idea for us to secure some profits until we get conviction for a higher move.
Stay safe my friends!
Go to our Crypto Banter Discord here where Sheldon and Kyle give updates on the charts and trades from The Daily Candle newsletter!