

📈📉 +100% Move Up IMMINENT for THIS Alt?
📈📉 +100% Move Up IMMINENT for THIS Alt?
PLUS: Time to Long THIS Gaming Token for MAJOR Gains!
Overview
Chart #1 - Crypto Total Market Cap (TOTAL) Daily
Chart #2 - Ocean Protocol (OCEANUSDT) 3-Day
Chart #3 - Pepe (PEPEUSDT) 2-Day
Chart #4 - Injective (INJUSDT) 8-Hour
Chart #5 - Fear and Greed Index
Chart #1 - Crypto Total Market Cap (TOTAL) Daily
Chartist: Sheldon
(For the chart screenshot, click here.)
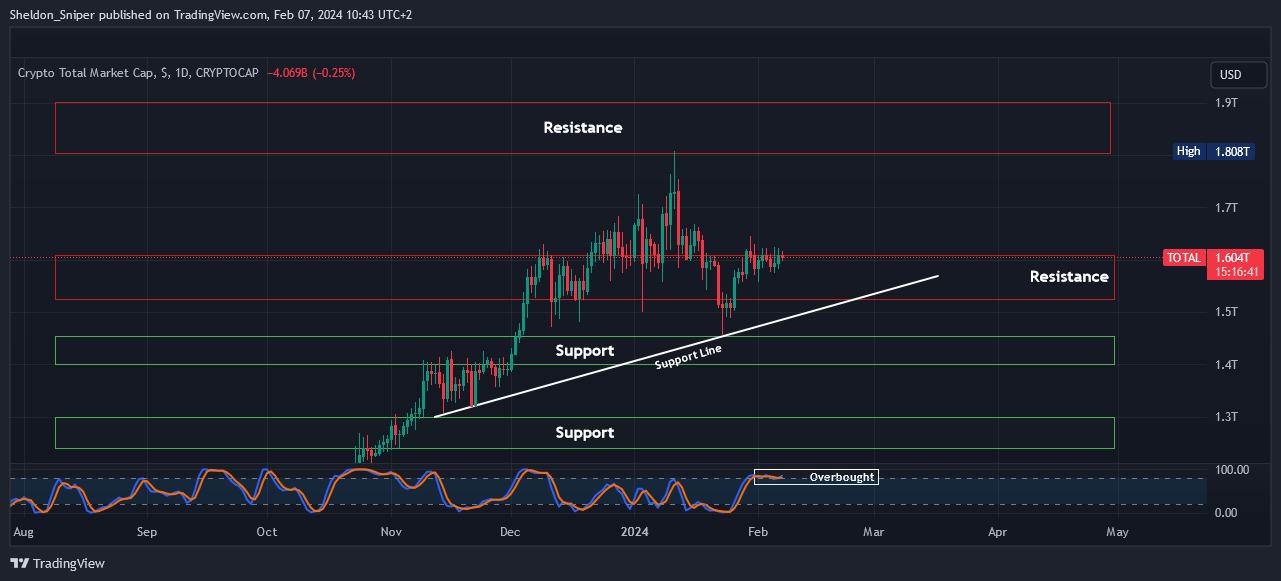
The TOTAL has been attempting to break through the $1.61 trillion resistance for over a week now. The market is overbought on the daily timeframe, but it can remain overbought for an extended period.
I sense the market could be nearing a decision point in the next few days though. If it gets rejected at this level, the next support is around $1.52 trillion, with additional support from November just below, at $1.5 trillion.
On the upside, if the market resumes its upward trend, the next resistance is at $1.7 trillion.
Sign-up and trade on Bybit today.
Exclusive $30,000 deposit rewards and bonuses up for grabs!
Chart #2 - Ocean Protocol (OCEANUSDT) 3-Day
Chartist: Kyle
(For the chart screenshot, click here.)
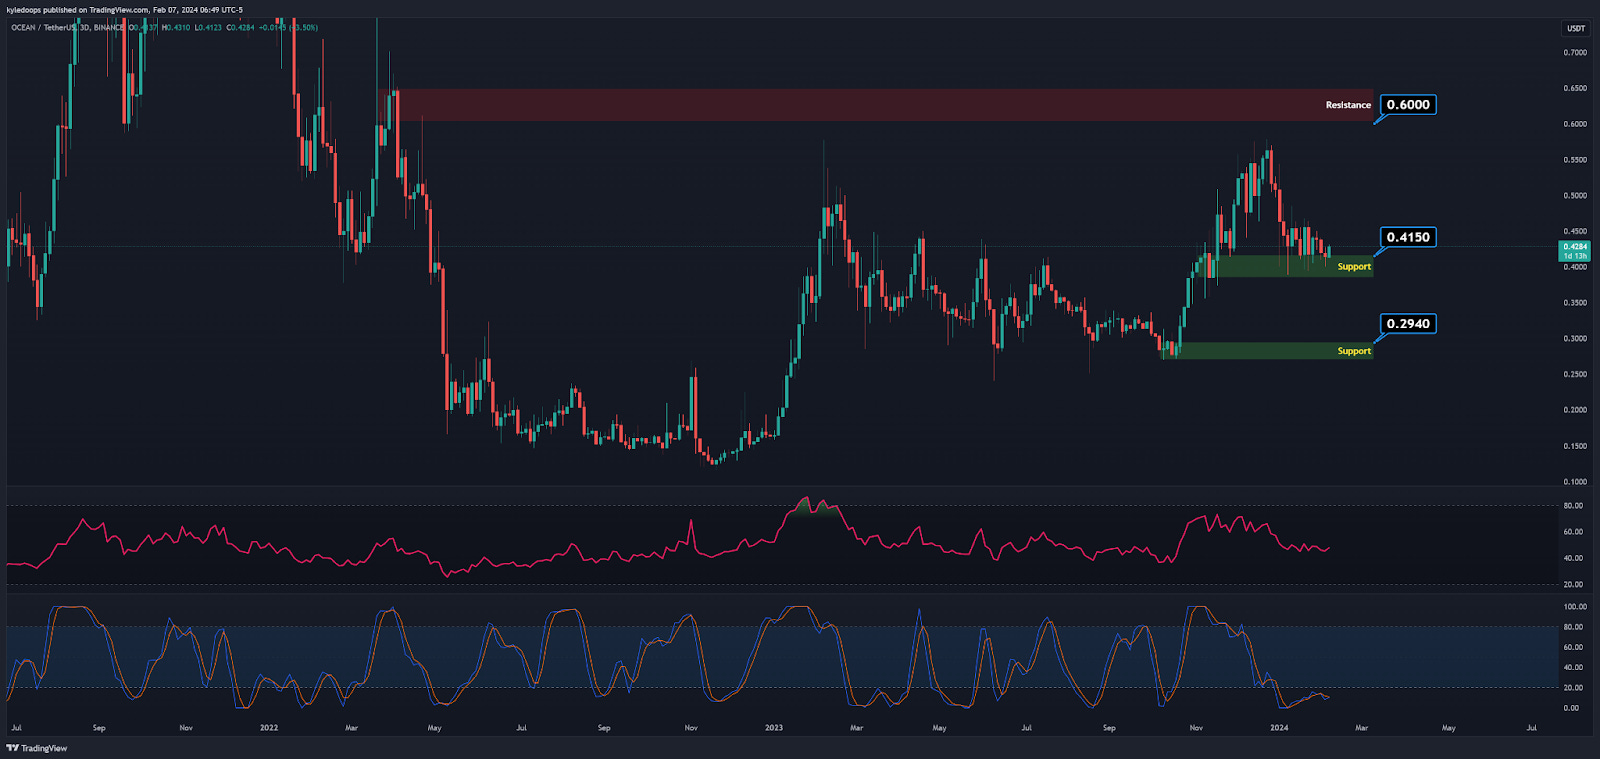
On the three-day chart, OCEAN appears to have found strong support and is building structure, instilling confidence that the next move will be up.
I expect to get closer to $0.41 for an entry and target $0.60, which represents a 45% price move.
The next support is to be found at $0.294, but it's unlikely to visit that level unless something drastic happens in the markets.
Claim your Bitget sign-up bonuses here (details below).

Outsmart 99% Of The Market!
Get full access into our Discord And Telegram group, where you'll find all of our premium content!
👉 Trade Signals!
👉 Trade Set-Ups!
👉 Trading Challenges!
👉 Education!
👉 SO MUCH MORE!
Chart #3 - Pepe (PEPEUSDT) 2-Day
Chartist: Kyle
(For the chart screenshot, click here.)
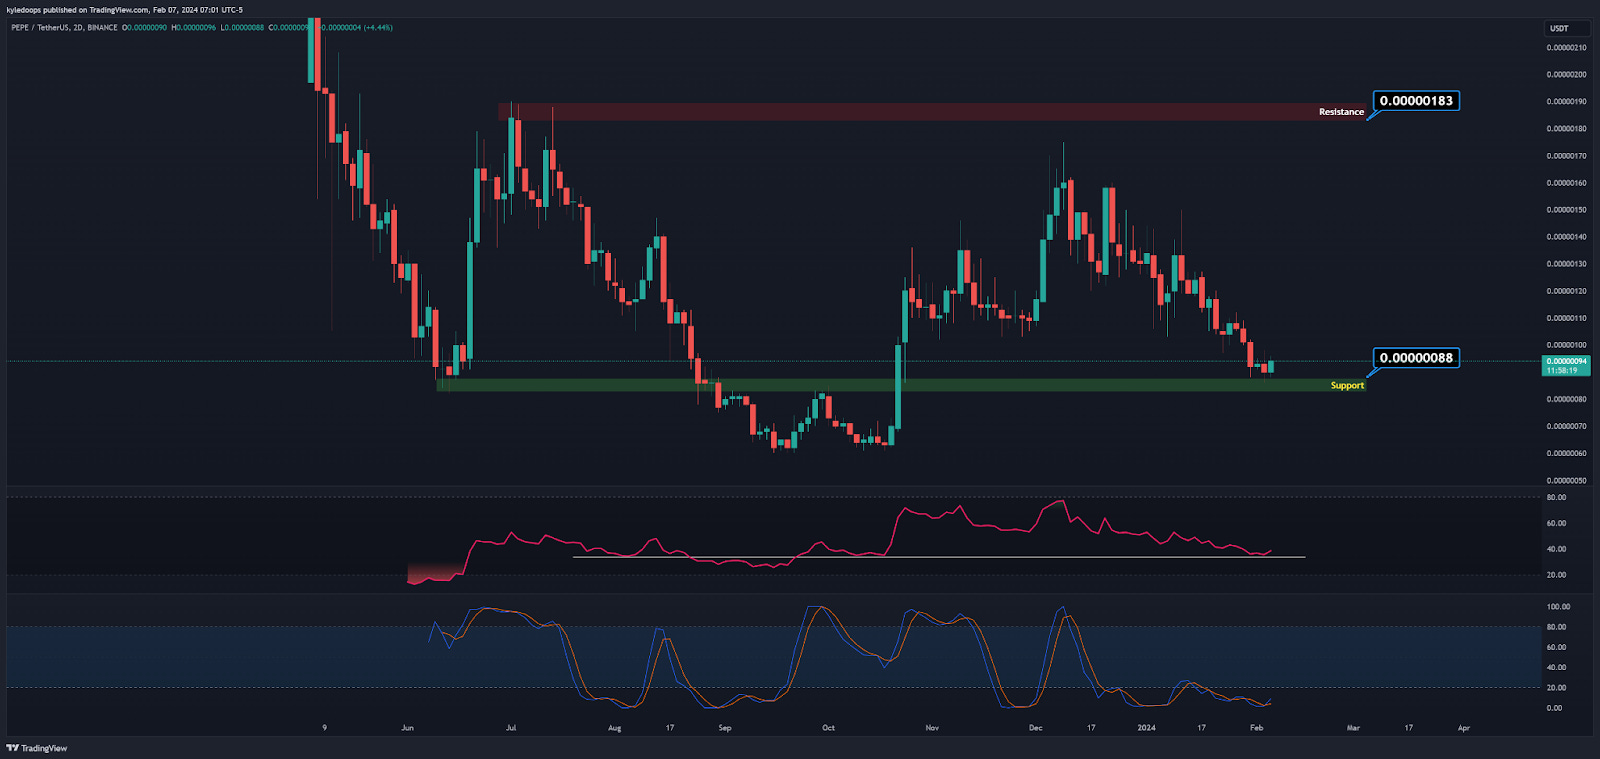
Is the frog ready for another jump?
Currently, it is sitting on a key support resistance level at $0.00000088. The Stochastic RSI is printing a cross up, and the RSI is reversing, so there’s potential for an upward movement.
The next resistance is at $0.00000183, so there’s room for just north of a 100% move.
Alts tend to move while Bitcoin is consolidating.
Be aware, we’ll get a partial position just in case it targets the lower support, at $0.00000065.
Claim your Bitget sign-up bonuses here (details below).
Chart #4 - Injective (INJUSDT) 8-Hour
Chartist: Sheldon
(For the chart screenshot, click here.)
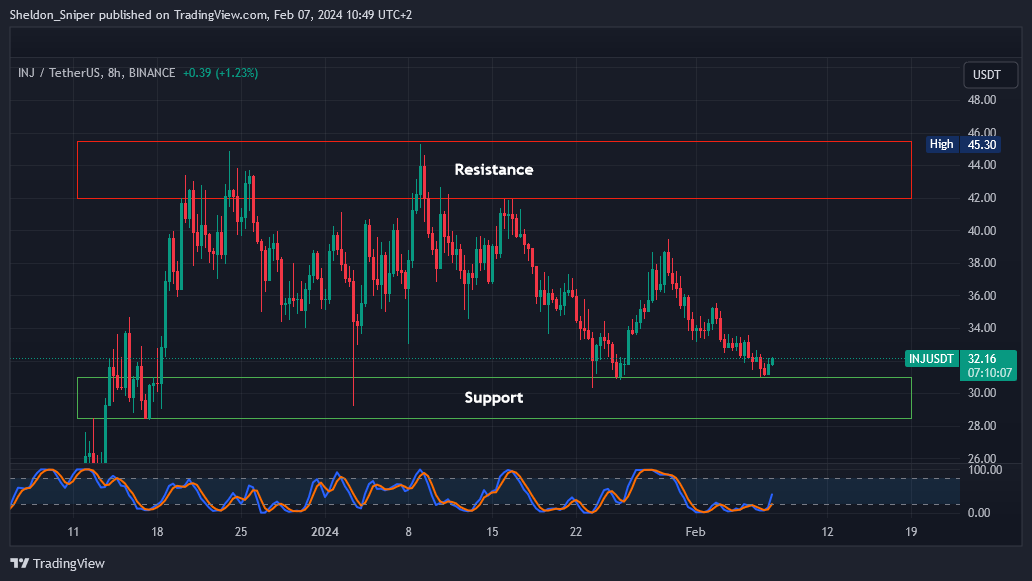
INJ has retraced to test the bottom of the range area of support, which has held for the last two months.
I am laddering into a long spot trade between $28.50 - $31.00, with the intention of taking profit at the top of the range resistance area of $42.00 - $45.50.
My stop loss will be set just below $28.00.
I believe the gaming narrative is primed for another rally to the upside, and INJ is one of the coins that could soar.
Claim your Bitget sign-up bonuses here (details below).
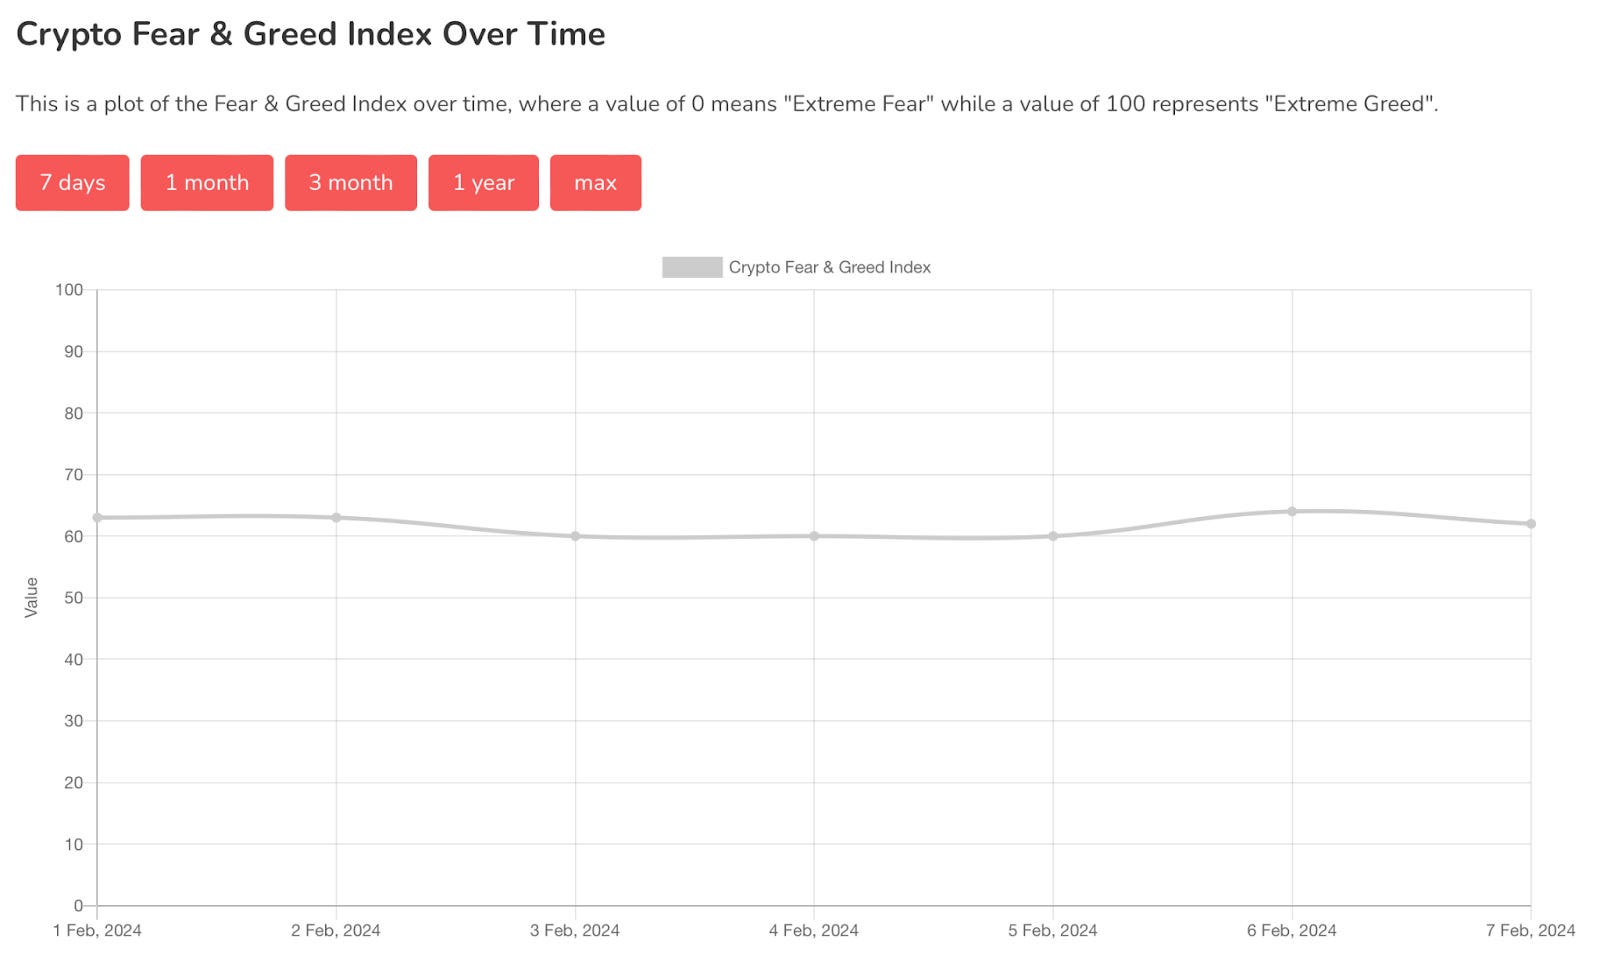
Chart #5 - Fear and Greed Index
The Fear and Greed Index is sitting at 62 today, indicating Greed.
The highest the index has been over the past seven days is 64, and the lowest is 60.
Banter’s Take
Bitcoin continues to grapple with the daily 50 MA and maintains its position above the 50% level within the range.
The landscape remains unchanged until the next move is made. Currently, sellers seem to have a slight edge, but the lack of volume and volatility prevents us from obtaining a clear direction.
It's a period of calmness before the storm!
Stay safe my friends!
Go to our Crypto Banter Discord here where Sheldon and Kyle give updates on the charts and trades from The Daily Candle newsletter!