

📈📉 +135% PROFIT on THIS Coin! Don't MISS It!
📈📉 +135% PROFIT on THIS Coin! Don't MISS It!
ALERT: And There's ANOTHER ONE That Could Print +111%!
Overview
Chart #1 - Polygon (MATICUSDT) 12-Hour
Chart #2 - Oasis Network (ROSEUSDT) Weekly
Chart #3 - GMT (GMTUSDT) Weekly
Chart #4 - Fantom (FTMUSDT) 12-Hour
Chart #5 - Fear and Greed Index
Chart #1 - Polygon (MATICUSDT) 12-Hour
Chartist: Sheldon
(For the chart screenshot, click here.)
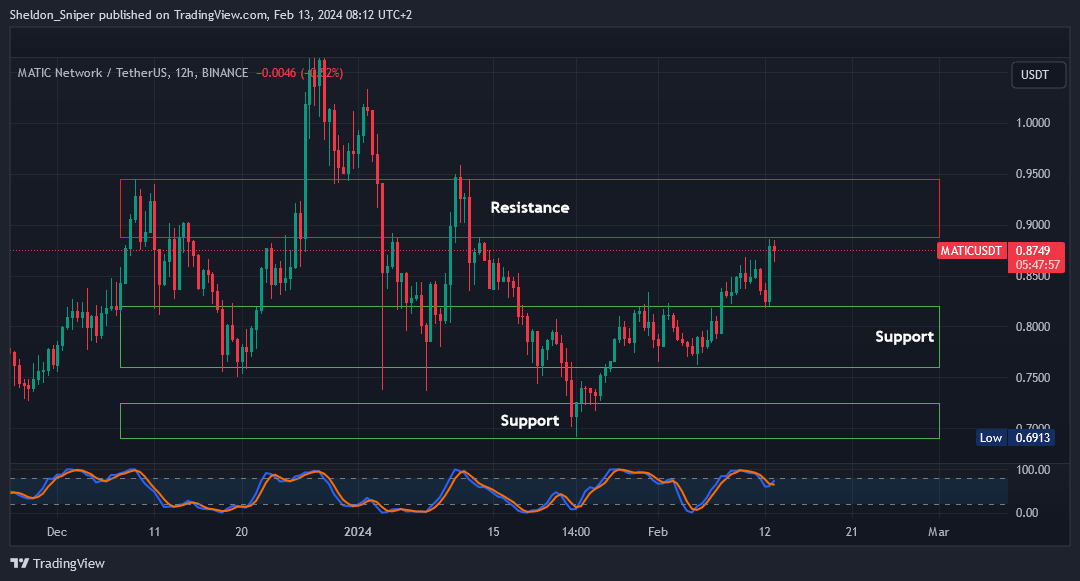
MATIC has encountered the next resistance level at $0.88.
I'm watching whether it can breach this level and establish it as support, potentially offering an entry for a spot long position with a stop loss slightly below $0.82.
Should the market pull back, and MATIC revisits the $0.82 support level, this could serve as another opportunity for a spot long entry, with a stop loss just under $0.76.
In that case, my take profit levels would be at $0.95, followed by $1.00 - $1.05.
Sign-up and trade on Bybit today.
Exclusive $30,000 deposit rewards and bonuses up for grabs!
Chart #2 - Oasis Network (ROSEUSDT) Weekly
Chartist: Kyle
(For the chart screenshot, click here.)
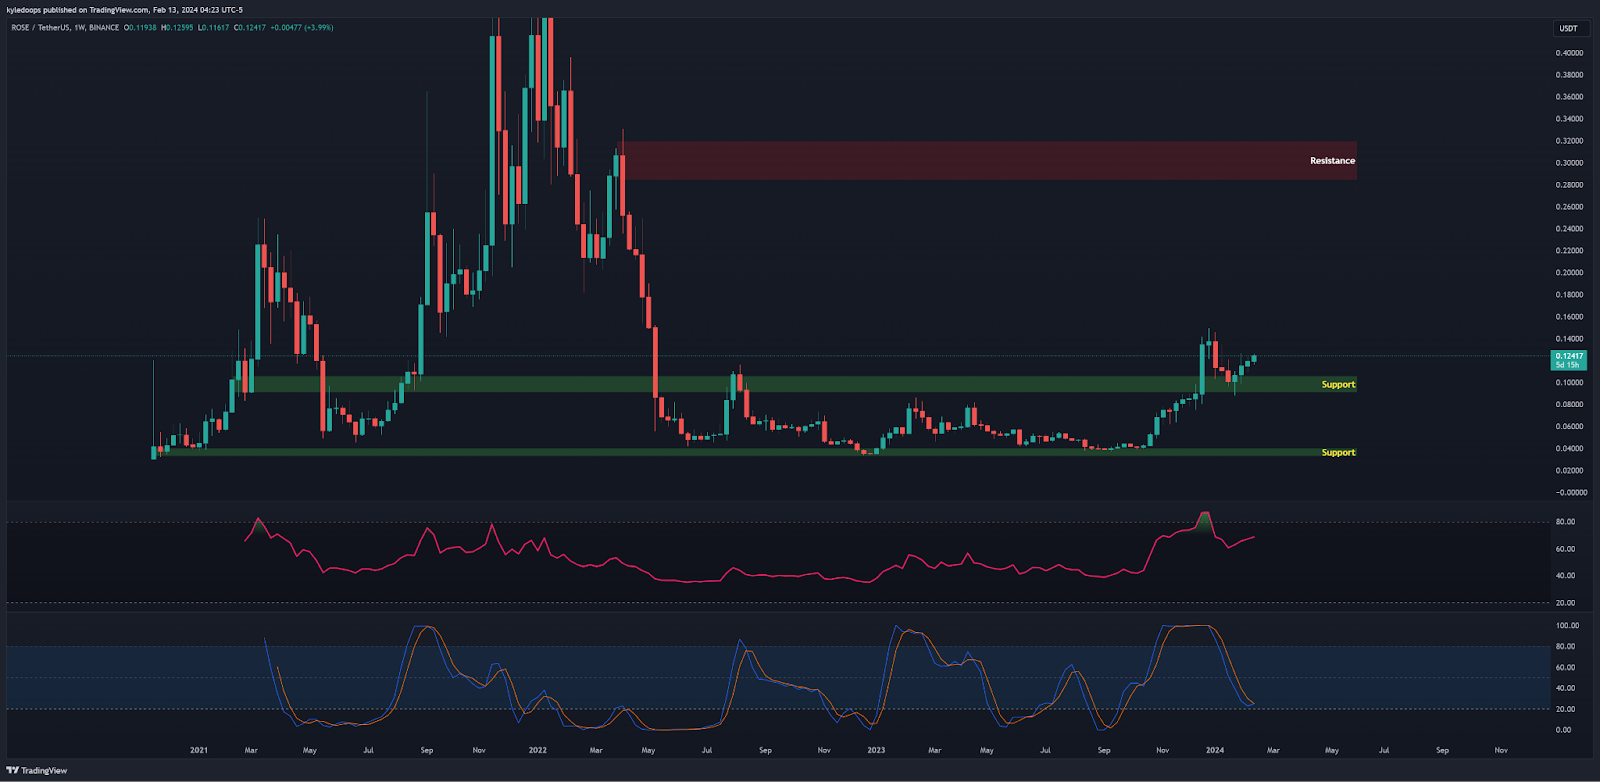
ROSE is once again showing bullish signs, like it wants to rip.
The Stochastic RSI is printing a bullish crossover, while price action is rebounding from the support level at $0.105.
The next resistance is at $0.283 - that’s a 135% move!
For a clean upward trajectory, ROSE needs to keep clearly above $0.121.
Claim your Bitget sign-up bonuses here (details below).

Outsmart 99% Of The Market!
Get full access into our Discord And Telegram group, where you'll find all of our premium content!
👉 Trade Signals!
👉 Trade Set-Ups!
👉 Trading Challenges!
👉 Education!
👉 SO MUCH MORE!
Chart #3 - GMT (GMTUSDT) Weekly
Chartist: Kyle
(For the chart screenshot, click here.)
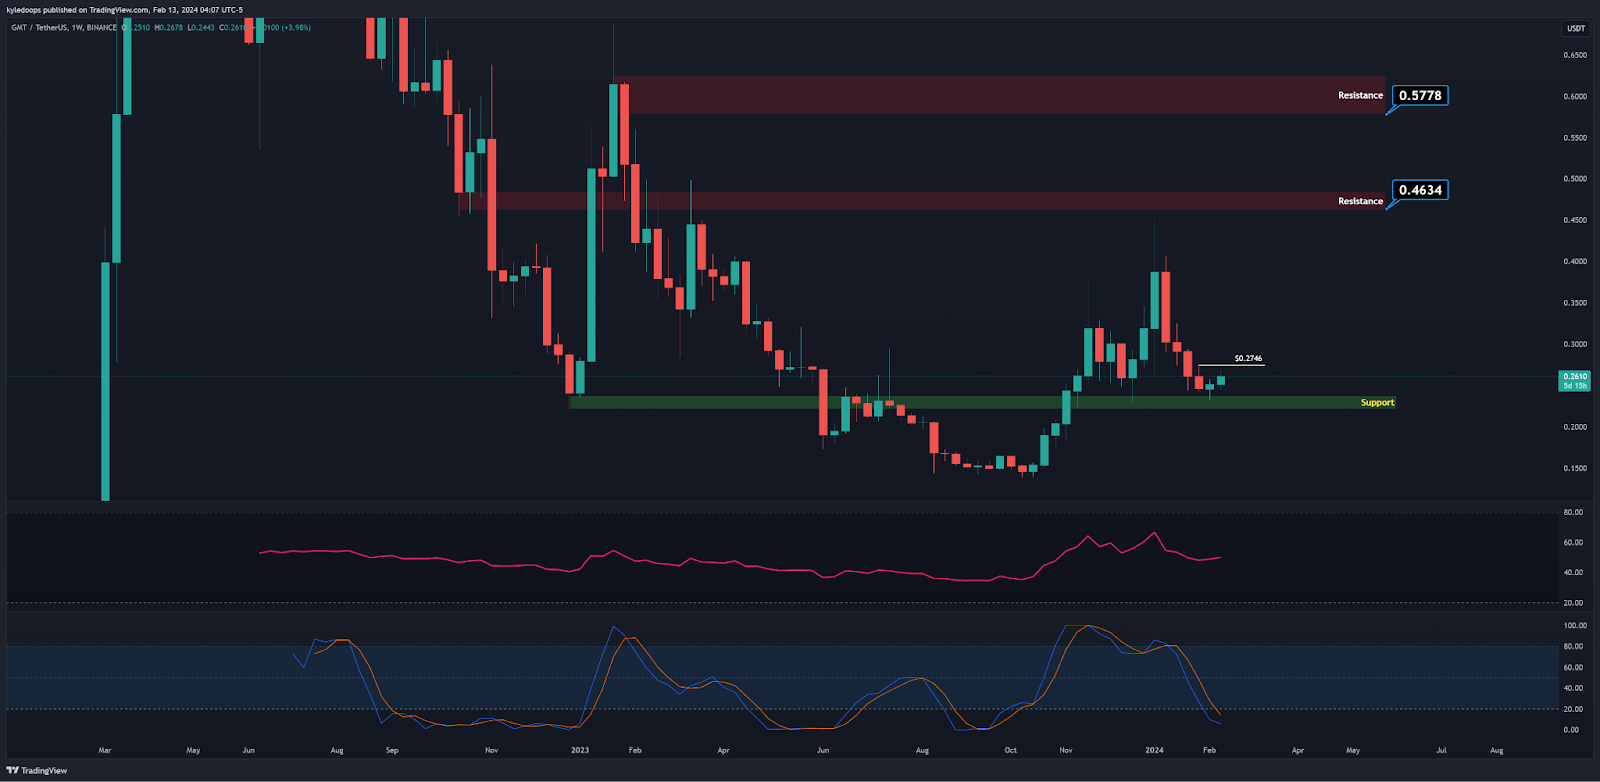
GMT is rebounding from this support level for the third time, while the Stochastic RSI is oversold.
Once it displays a bullish crossover and the price breaks above $0.2746, that would give us a nice entry point.
The next big resistance is located at $0.4634, offering a massive 68% potential gain, followed by another resistance at $0.5778, which could lead to a 111% gain.
The point of invalidation for this setup would be if the price breaks and remains below $0.2211.
Claim your Bitget sign-up bonuses here (details below).
Chart #4 - Fantom (FTMUSDT) 12-Hour
Chartist: Sheldon
(For the chart screenshot, click here.)
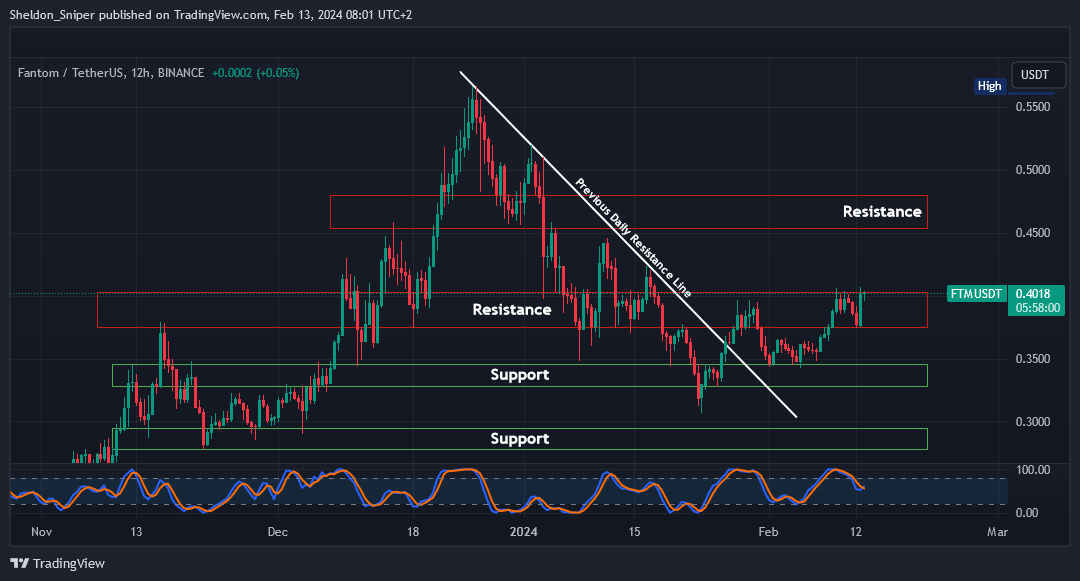
Many Altcoins are at resistance levels, but at this stage, it's unclear whether the market will correct now or move higher before correcting.
FTM is at the top of its range resistance level, at $0.4025, and I'm watching to see if it can break through the $0.4025 level and convert it into support.
If that occurs, it will provide an opportunity to go long on spot, with a stop loss set just below $0.37.
If the market retraces, and FTM retests the bottom of the range resistance at around $0.3750, it would also give us an entry point to go long, with a stop loss just below $0.35. The take profit areas would be at the next resistance levels, which are $0.45 - $0.47, and $0.55 - $0.60.
Claim your Bitget sign-up bonuses here (details below).
Chart #5 - Fear and Greed Index
The Fear and Greed Index is sitting at 79 today, indicating Extreme Greed.
The highest the index has been over the past seven days is 79, and the lowest is 62.

Banter’s Take
Bitcoin finally broke through $50,000 and is now in price discovery mode, gradually eliminating any sell walls that were present at $50,000.
As we await the opening of the US trading session, it's worth keeping an eye on Ethereum, which looks primed for a move.
Stay safe my friends!
Go to our Crypto Banter Discord here where Sheldon and Kyle give updates on the charts and trades from The Daily Candle newsletter!