

📈📉 +140% Gains Soon on This HOT Narrative Coin?
📈📉 +140% Gains Soon on This HOT Narrative Coin?
PLUS: Our THETA Trade is in PROFIT! Don't Miss Out!
Overview
Chart #1 - Fantom (FTMUSDT) 12-Hour
Chart #2 - Avalanche (AVAXUSDT) Daily
Chart #3 - Arweave (ARUSDT) 8-Hour
Chart #4 - Polkadot (DOTUSDT) 12-Hour
Chart #5 - Fear and Greed Index
We Were CORRECT About THETA! 👇
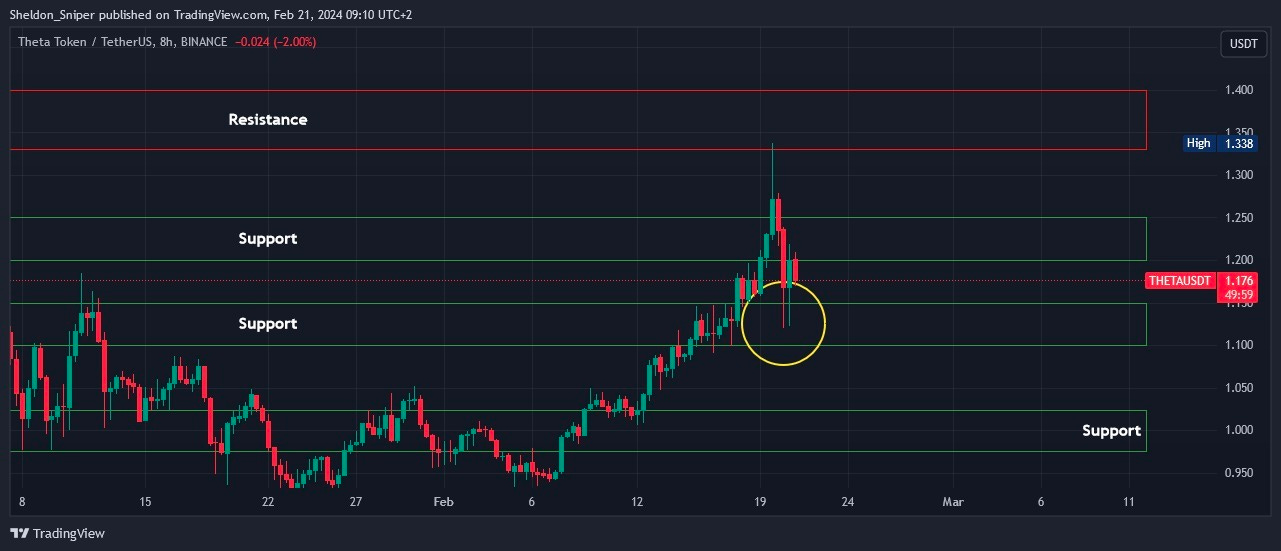
Our chartists have been killing it, as always!
Here’s Sheldon’s THETA trade from yesterday. The price reversed right off his buy zone!
Are you trading with him yet, degens? 👇
You only have about 550 days left in the bull market! And that’s when trading becomes easier due to volatility. Don't miss out on an opportunity to change your lives forever!
Head over to Bybit now and get set up!
And subscribe so you don’t miss out!
Chart #1 - Fantom (FTMUSDT) 12-Hour
Chartist: Sheldon
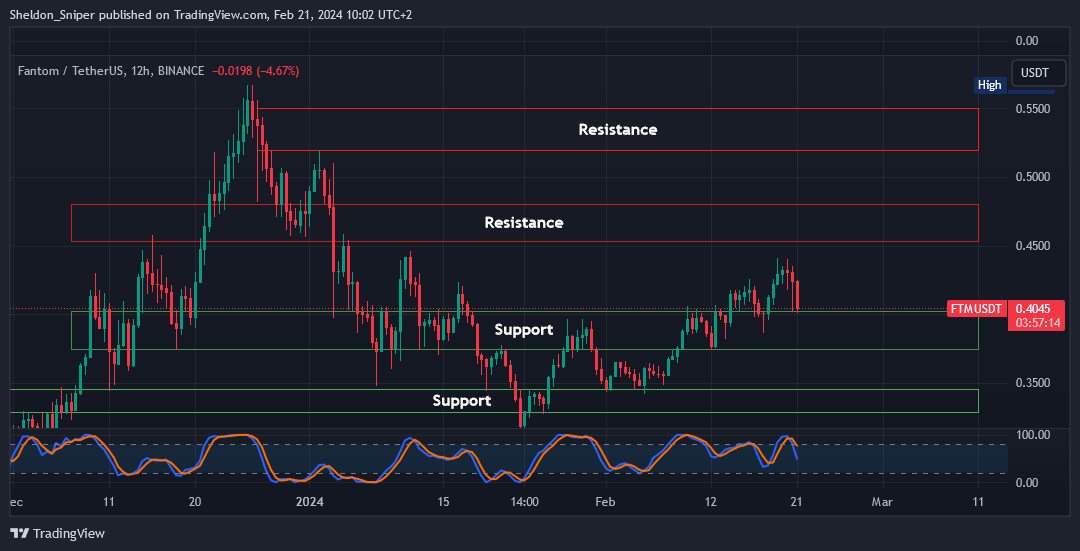
(For the chart screenshot, click here.)
The $0.40 top of the range has been holding as support for over a week now, so as long as support holds, it makes sense to take a trade!
The market is very volatile at the moment, so look at reducing risk by taking a spot long trade at this level, with a slightly wider stop loss.
Take Profits:
At the next area of resistance.
$0.45 - $0.47 (12% -17%)
$0.5250 - $0.57 (31% - 42%)
Stop Loss:
Just below $0.38
One of the best places take the trade is on Bybit. Easy to use and intuitive. What are you waiting for?
Chart #2 - Avalanche (AVAXUSDT) Daily
Chartist: Kyle
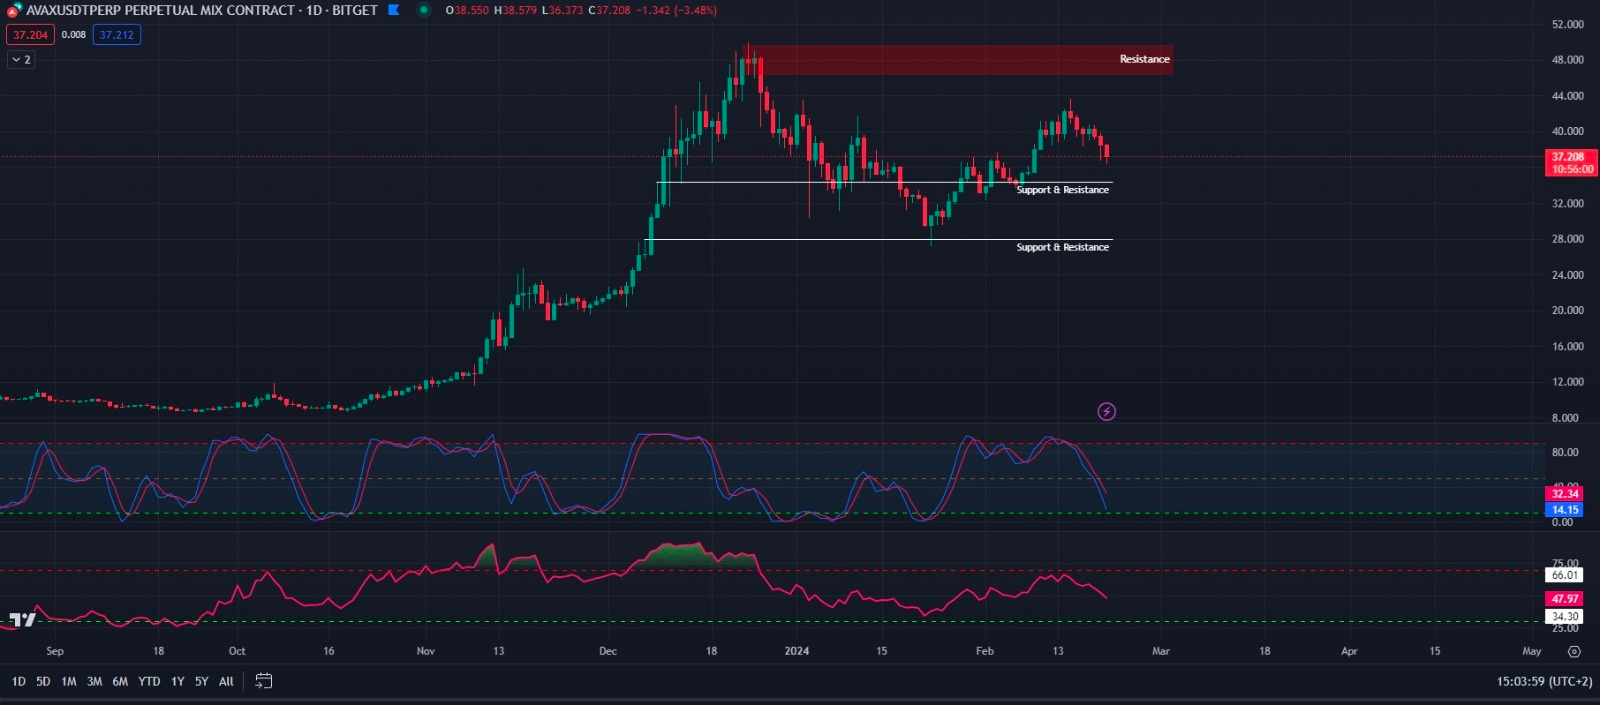
(For the chart screenshot, click here.)
AVAX is currently at $37.
That level is acting as local support. If it loses it, it will head towards $33.50 or possibly even lower at $23.00.
If the market continues to the upside, the next resistance is at $46.
Either way, the trades on AVAX could be huge. You can easily make an account on Bitget and prepare for them.

Outsmart 99% Of The Market!
Get full access into our Discord And Telegram group, where you'll find all of our premium content!
👉 Trade Signals!
👉 Trade Set-Ups!
👉 Trading Challenges!
👉 Education!
👉 SO MUCH MORE!
Chart #3 - Arweave (ARUSDT) 8-Hour
Chartist: Kyle
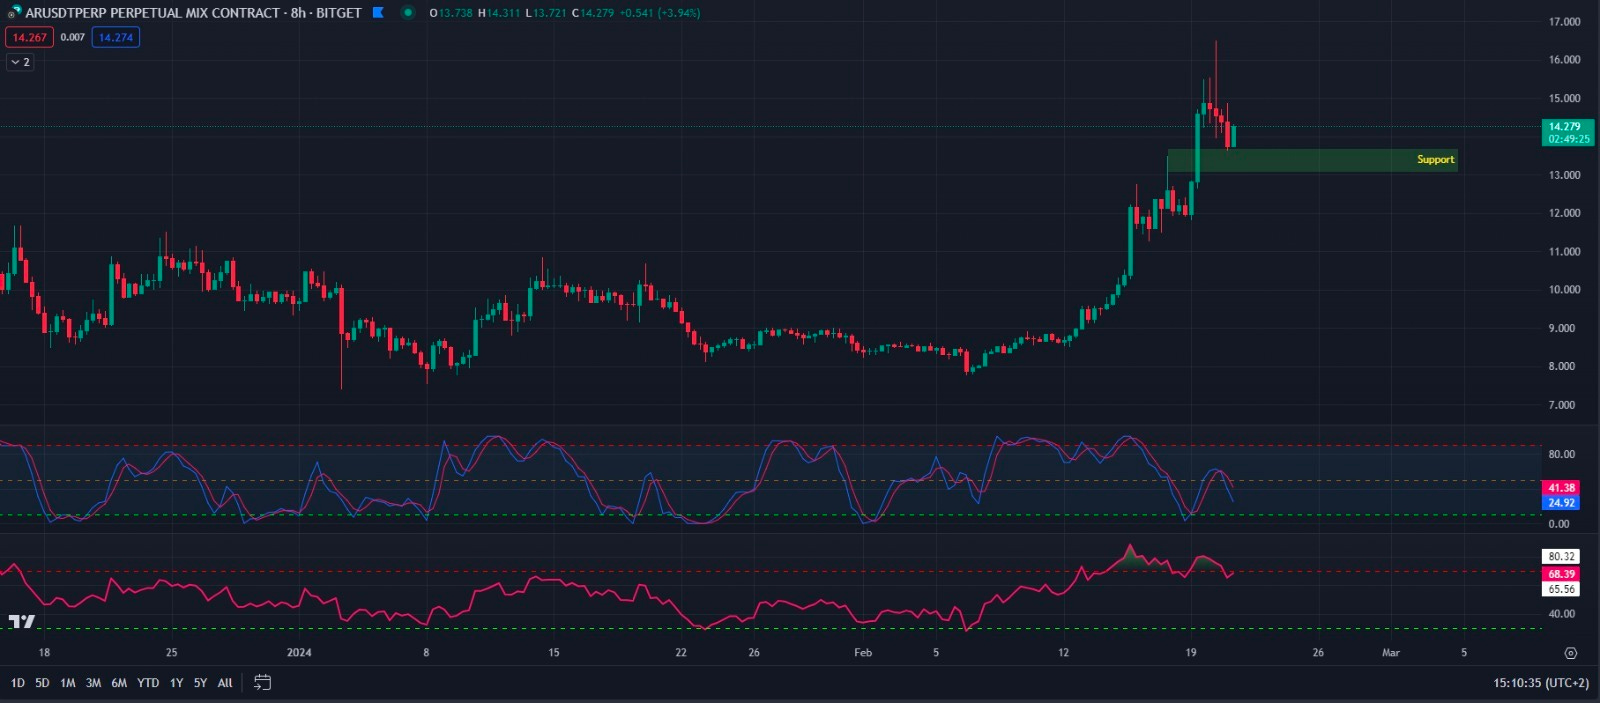
(For the chart screenshot, click here.)
AR had a massive move to the upside all the way to $16.5 yesterday!
Now it has retraced back to $13.65 and it looks that it found a local support here.
If it actually fails to hold here, it could head back down to $11.60.
But, the next major resistance is all the way up at $33! That’s a massive 140% move. Imagine what you can do with a little added leverage on that!
Don’t miss out! Get set up on Bitget to profit big!
Chart #4 - Polkadot (DOTUSDT) 12-Hour
Chartist: Sheldon

(For the chart screenshot, click here.)
As with FTM, the $7.35 top of the range has been holding as support for DOT for over a week now and it is once again testing that level.
The market is currently very volatile, so we’ll reduce risk by taking a spot trade, with a slightly bigger stoploss.
Take Profits:
At the next area of resistance.
$8.00 - $8.50 (9% - 15%)
Around $9.60 - $10.00 (30% - 36%
Stop Loss:
Just below the bottom of the range support of $7.00
You have the levels, now set them on your account over at Bitget.
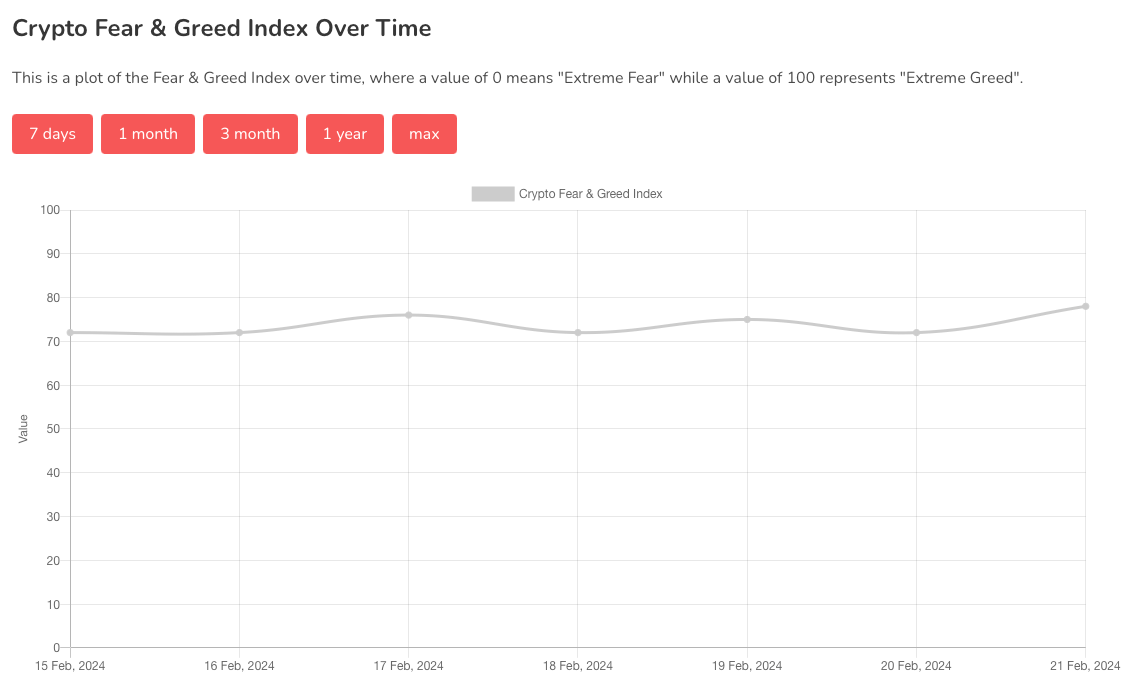
Chart #5 - Fear and Greed Index
The Fear and Greed Index is sitting at 78 today, indicating Extreme Greed.
The highest the index has been over the past seven days is 78, and the lowest is 72.
Banter’s Take
The market could be getting overheated, and many of these trades could be invalidated if Bitcoin decides to drop.
The best thing to do is to pay close attention and tighten the stop losses.
Stay safe my friends!
Go to our Crypto Banter Discord here where Sheldon and Kyle give updates on the charts and trades from The Daily Candle newsletter!