

📈📉 $1,400 ETH Incoming? + Our Gold Trade is in PROFIT!
📈📉 $1,400 ETH Incoming? + Our Gold Trade is in PROFIT!

Overview
Chart #1 - Bitcoin Dominance (BTC.D) 3-Day Chart
Chart #2 - Gold Spot (XAUUSD) Hourly Chart
Chart #3 - Ethereum (ETHUSD) Daily Chart
Chart #4 - Bitcoin (BTCUSDT) Daily Chart
Chart #5 - Fear and Greed Index

Chart #1 - Bitcoin Dominance (BTC.D) 3-Day Chart
Chartist: Sheldon
(For the chart screenshot, click here.)
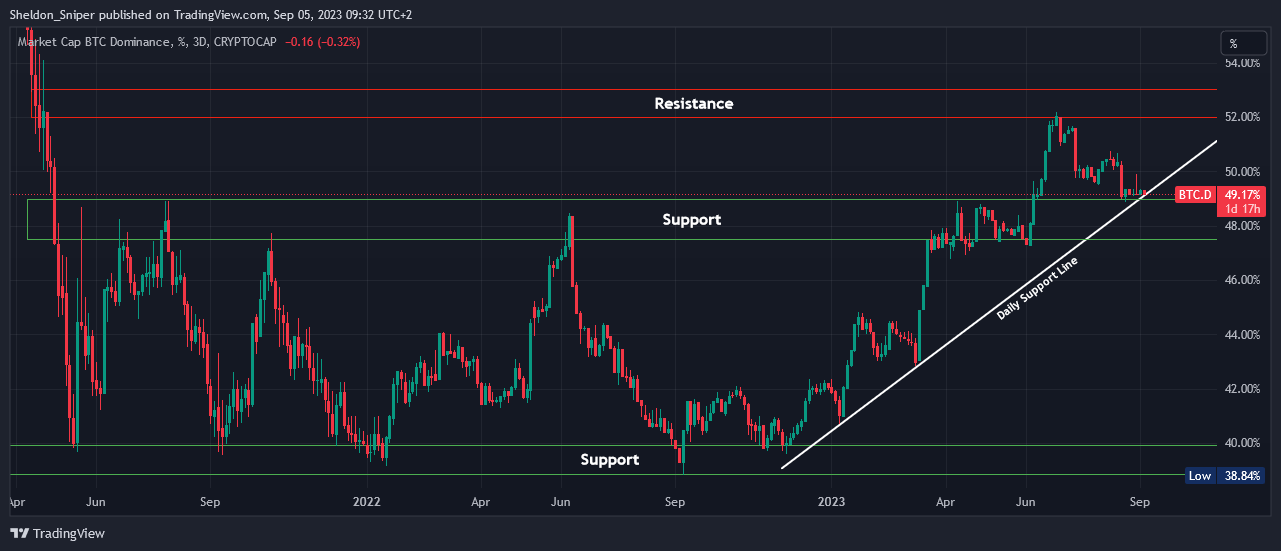
Looking at Bitcoin Dominance on a higher time frame, it has been in a range since June 2021, between a support of 40% and a resistance of 49%.
In June, it broke out of the range to the upside as cash continued to leave the alts, flowing into Bitcoin. Now, it has reached the ascending daily support line that originated at the beginning of 2023, which is acting as support. There is a lot of speculation at the moment that the crypto is going to continue to fall over the next couple of weeks. If this happens, cash would continue to leave the alts, resulting in BTC.D moving up.
The next major area of resistance is at 52% - 53%.
𝗣𝗿𝗶𝗺𝗲 𝗫𝗕𝗧
Sign up for a new Trading Account on Prime XBT!
Receive a deposit bonus of up to $7,000 with promo code: SheldonSniper
Sign-up and trade on Bybit today.
Exclusive $30,000 deposit rewards and bonuses up for grabs!
Chart #2 - Gold Spot (XAUUSD) Hourly Chart
Chartist: Kyle
(For the chart screenshot, click here.)
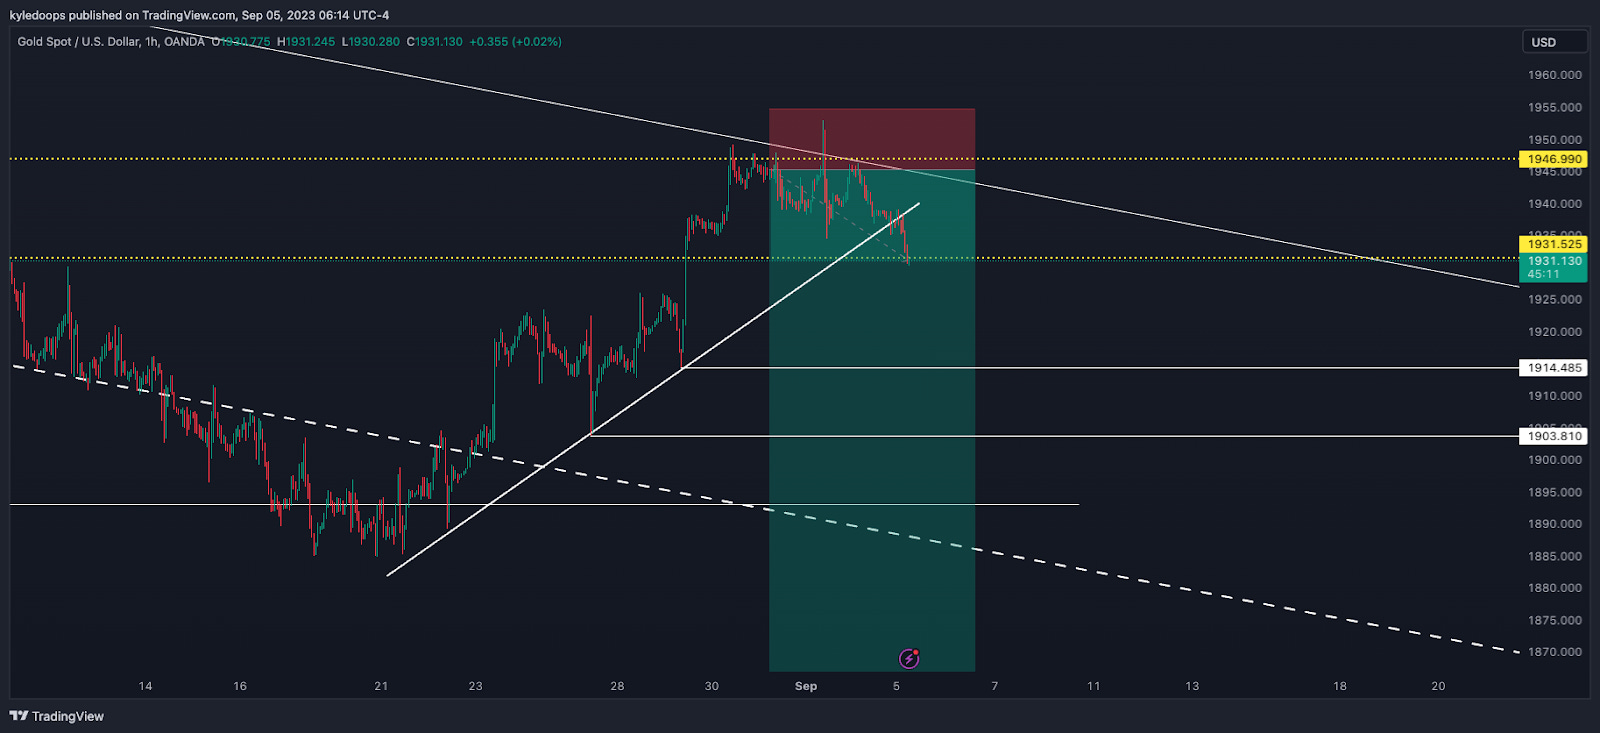
The gold trade is fully in profit right now!
Our stop losses can be moved to break-even at this point. The up-sloping trend line has broken, giving added confluence to the trend shift in gold and the directional bias on this trade.
My Take Profit 1 (TP1), where I'll take one-third off the table, is at $1,914; my TP2 for another one-third is at $1,903.
I will update on the final third when relevant.
𝗣𝗿𝗶𝗺𝗲 𝗫𝗕𝗧
Sign up for a new Trading Account on Prime XBT!
Receive a deposit bonus of up to $7,000 with promo code: KyleDoops
Chart #3 - Ethereum (ETHUSD) Daily Chart
Chartist: Kyle
(For the chart screenshot, click here.)
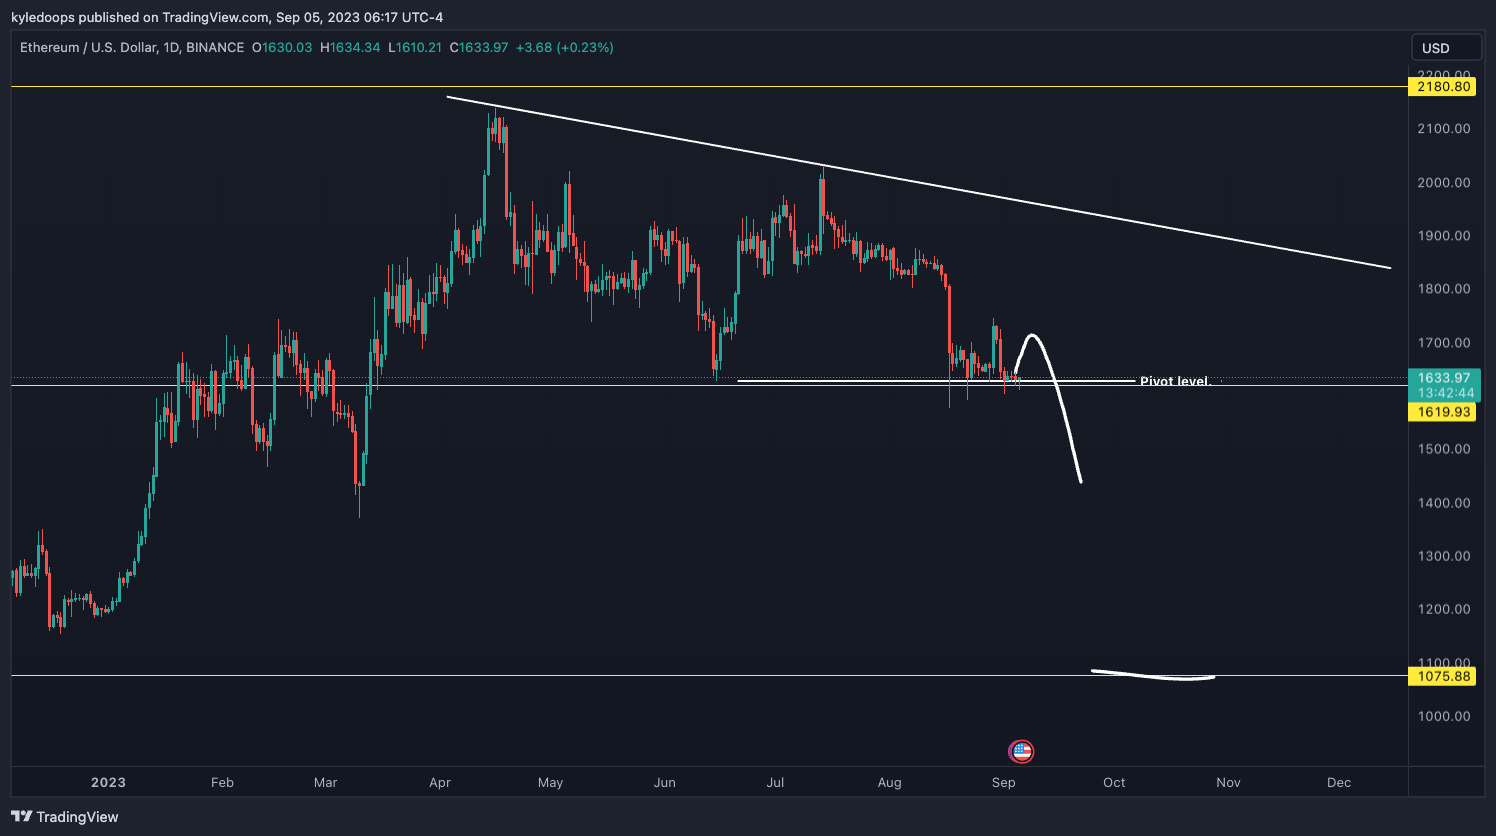
ETH will likely have a short squeeze back up to $1,700 before later continuing its journey to the downside.
The next attempt at the $1,620 support (mid-range) is likely to break it, and in that case, the next support is $1,400.
Claim your Bitget sign-up bonuses here (details below).
Chart #4 - Bitcoin (BTCUSDT) Daily Chart
Chartist: Sheldon
(For the chart screenshot, click here.)
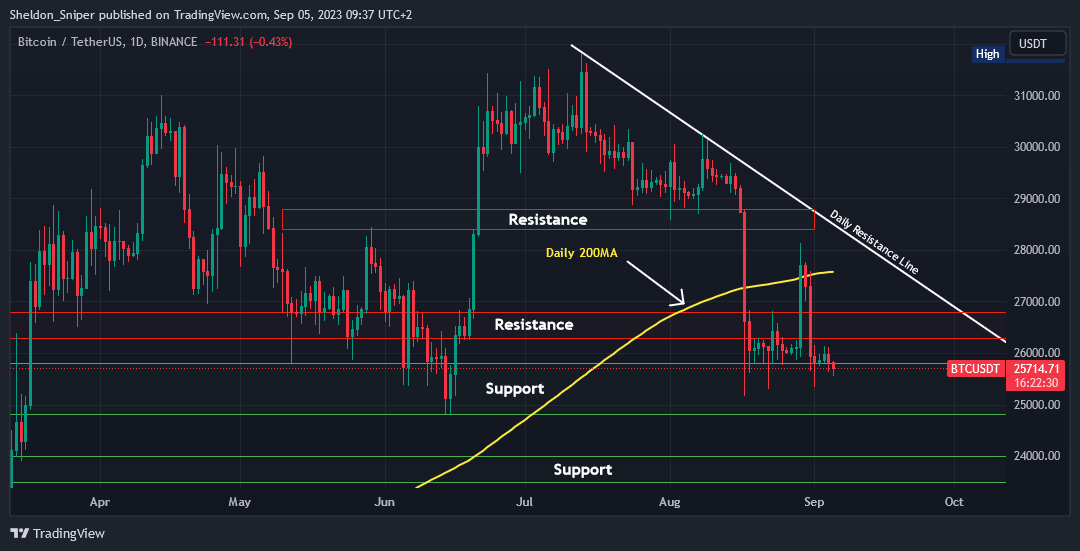
Last week, we saw Bitcoin getting rejected at around $28,000, where the bears stepped in and reversed the trend back to the downside.
Over the last five days, the price of BTC has been in a tight range between a support of $25,500 and resistance at around $26,000. The consolidation structure that it is currently building is very bearish. There is a high chance of the price continuing to the downside. However, if the bulls can regain the $26,300 - $26,800 area of resistance, the next resistance is at the daily 200 Moving Average, around $27,500.
If the $25,500 level of support is lost, the next support is at the June lows of $24,800.
Claim your Bitget sign-up bonuses here (details below).
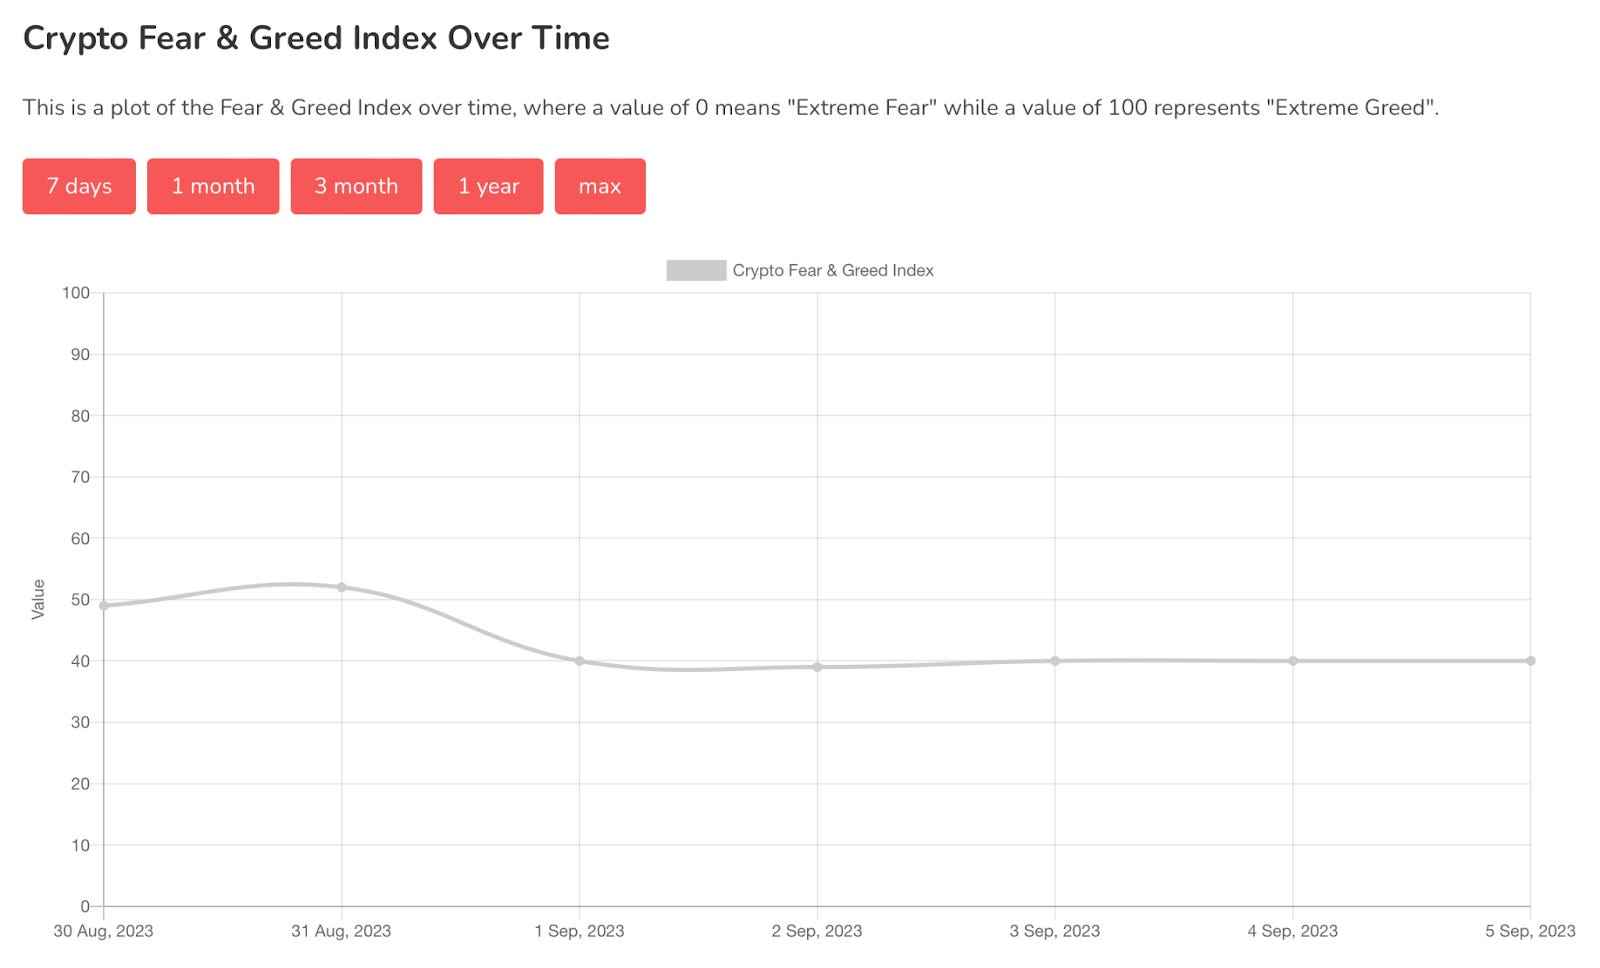
Chart #5 - Fear and Greed Index
The Fear and Greed Index is sitting at 40 today, indicating Fear.
The highest the index has been over the past seven days is 52, and the lowest is 39.
Banter’s Take
Shorts are heavily stacked against longs, and the short squeeze could commence today as US markets reopen following a bank holiday. But don't be fooled. A short squeeze is likely to lead to lower highs and a trend continuation to the downside.
Stay safe my friends!
Go to our Crypto Banter Discord here where Sheldon and Kyle give updates on the charts and trades from The Daily Candle newsletter!