

📈📉 $2,300 ETH Incoming?
📈📉 $2,300 ETH Incoming?
PLUS: Bitcoin - Invalidation Would be a Close Below This EMA!
Overview
Chart #1 - U.S. Dollar (DXY) Daily
Chart #2 - Ethereum (ETHUSD) 4-Hour
Chart #3 - Bitcoin (BTCUSD) 4-Hour
Chart #4 - Solana (SOLUSDT) 3-Day
Chart #5 - Fear and Greed Index
Chart #1 - U.S. Dollar (DXY) Daily
Chartist: Sheldon
(For the chart screenshot, click here.)
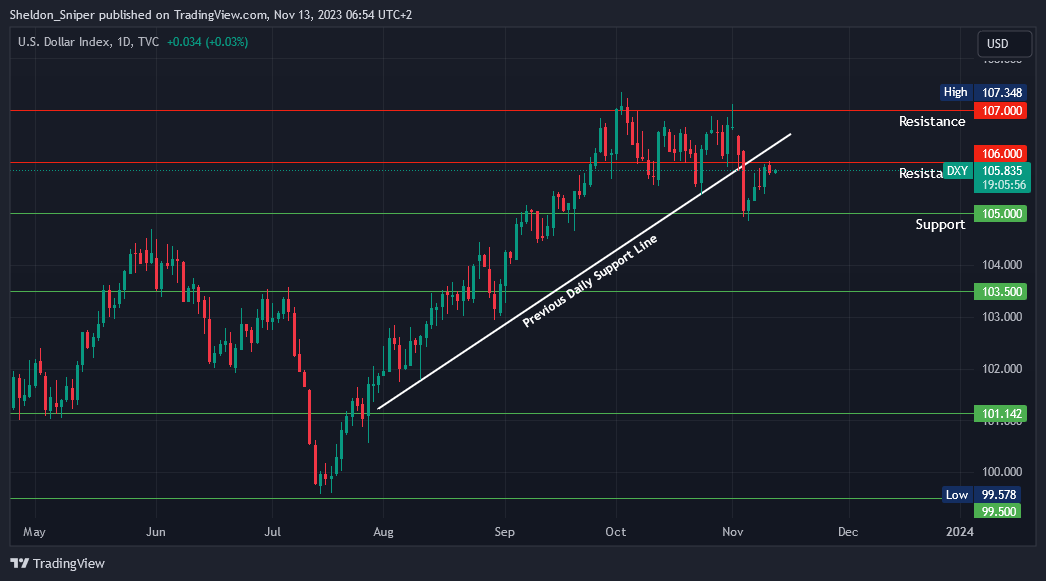
The DXY is currently at both the 106.00 level of resistance and also very close to retesting the previous daily support line, which will now be acting as resistance.
I am looking for a rejection in the 106.00 – 106.50 area of resistance, giving risk-on assets a relief.
Sign-up and trade on Bybit today.
Exclusive $30,000 deposit rewards and bonuses up for grabs!
Chart #2 - Ethereum (ETHUSD) 4-Hour
Chartist: Kyle
(For the chart screenshot, click here.)
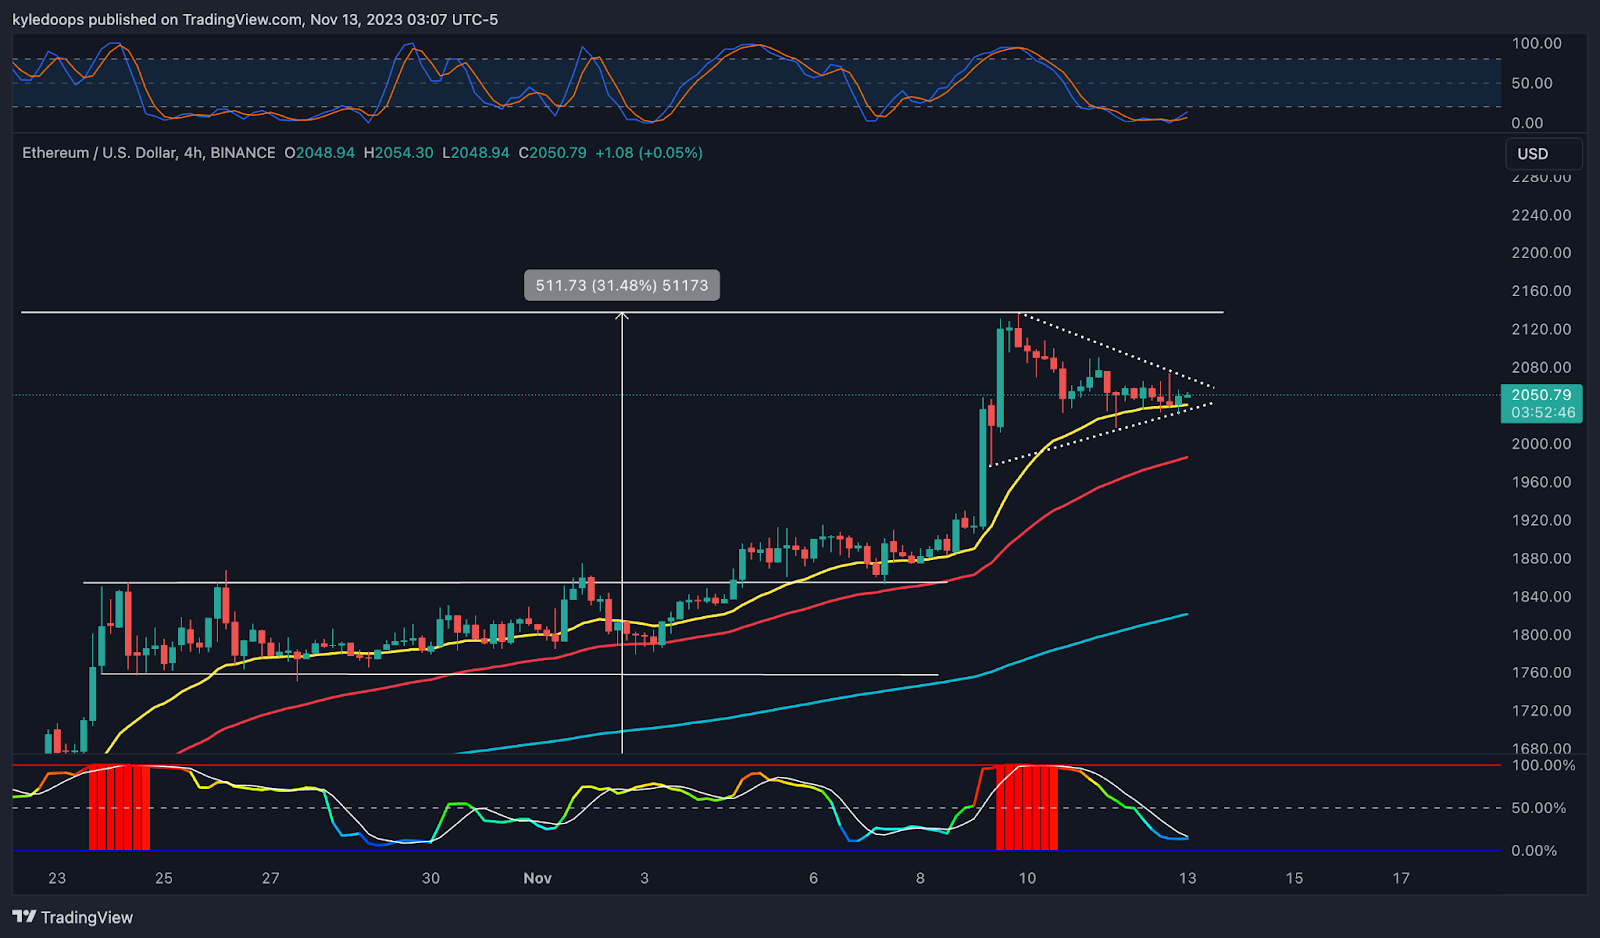
ETH is holding the 21 ema (yellow one) whilst consolidating into a bullish pennant.
What this means is a likely trend continuation.
ETH’s next stop could be $2,300.
Claim your Bitget sign-up bonuses here (details below).

Outsmart 99% Of The Market!
Get full access into our Discord And Telegram group, where you'll find all of our premium content!
👉 Trade Signals!
👉 Trade Set-Ups!
👉 Trading Challenges!
👉 Education!
👉 SO MUCH MORE!
Chart #3 - Bitcoin (BTCUSD) 4-Hour
Chartist: Kyle
(For the chart screenshot, click here.)
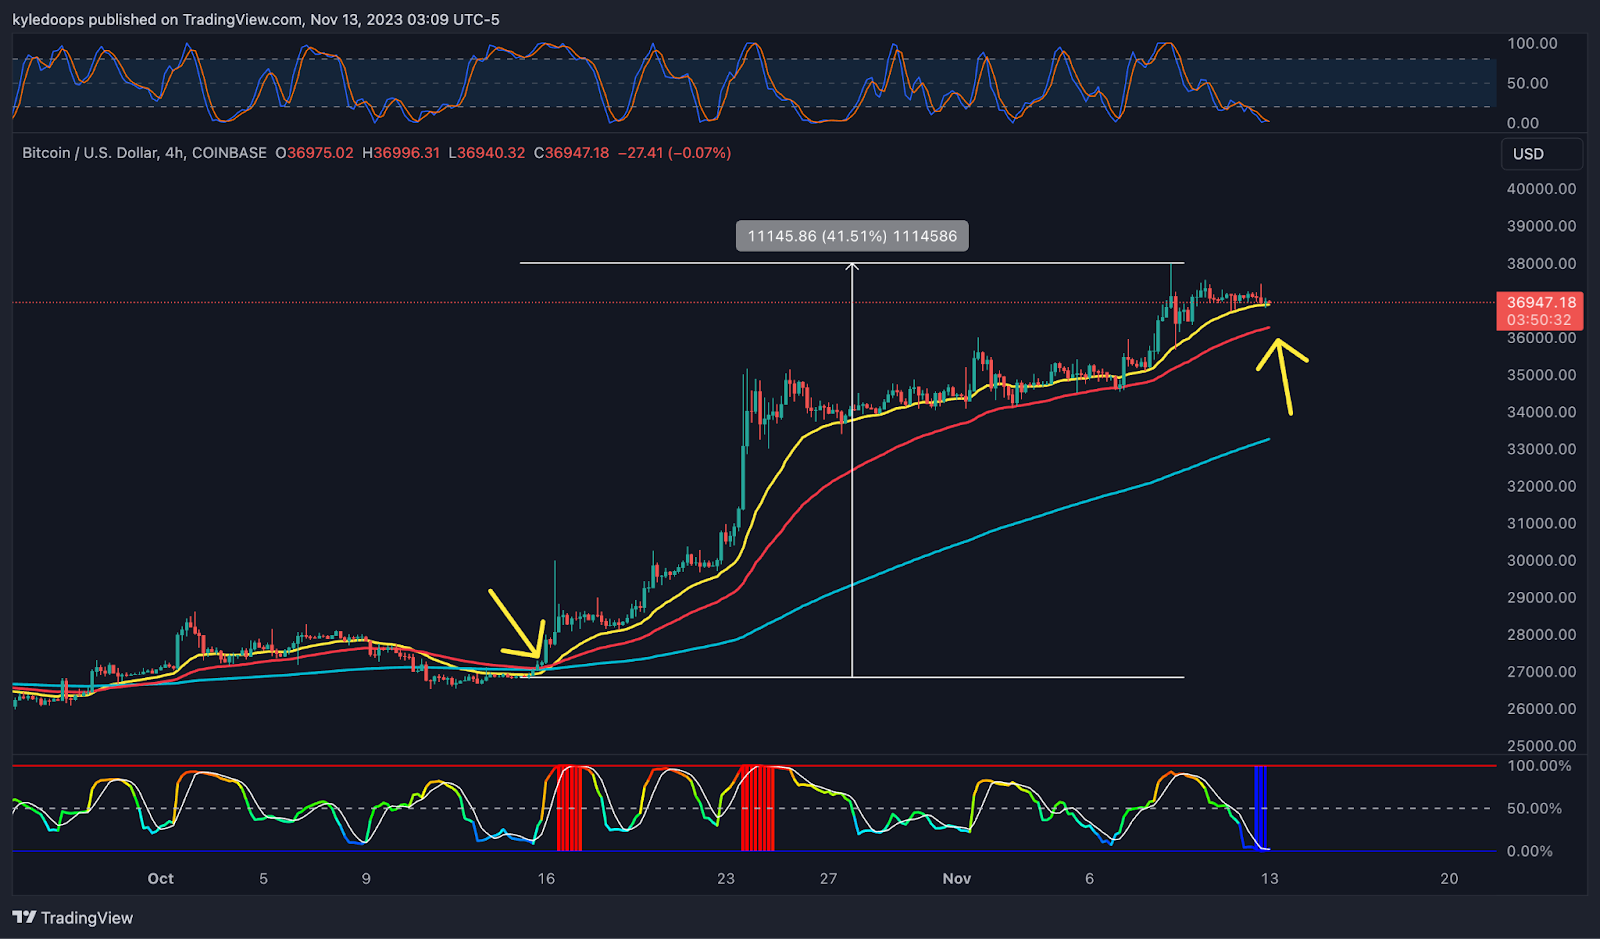
Bitcoin is also holding its 21 ema (yellow), and is coming off of low volatility.
The Stochastic RSI's have reset, which also means a trend continuation is at play.
Invalidation would be closes below the 50 ema (red).
Claim your Bitget sign-up bonuses here (details below).
Chart #4 - Solana (SOLUSDT) 3-Day
Chartist: Sheldon
(For the chart screenshot, click here.)
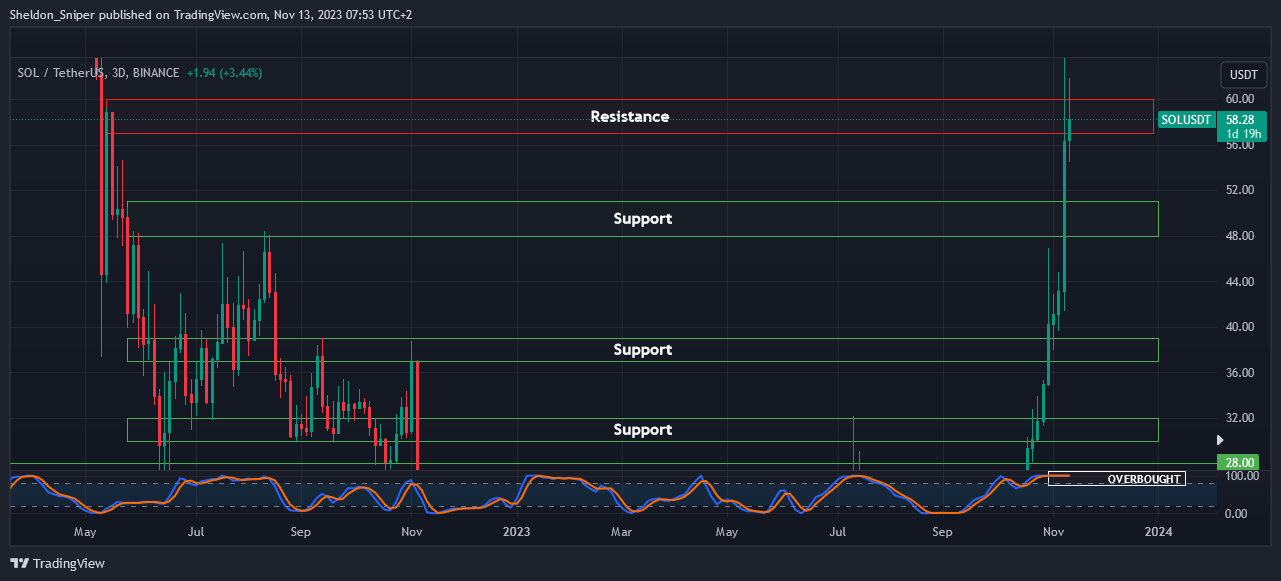
SOL is currently extremely overbought on higher timeframes, and looking at the rest of the market, I think we are due for a correction very soon.
If the market retraces from here, the next area of support is at $48.00 - $51.00, with there even being a possibility of a deeper correction down to $36.50 - $38.00.
There are buyers eagerly waiting at lower levels for the price to retrace!
Claim your Bitget sign-up bonuses here (details below).
Chart #5 - Fear and Greed Index
The Fear and Greed Index is sitting at 72 today, indicating Greed.
The highest the index has been over the past seven days is 73, and the lowest is 66.

Banter’s Take
Bitcoin is coming off a bearish divergence on the daily, but the trend overall, even on lower timeframes, continues to remain up.
The bearish divergence could just indicate a consolidation before the next move up, so it’s not necessarily a sell signal. But it is something to watch for and be aware of in the event of a greater pullback.
Stay safe my friends!
Go to our Crypto Banter Discord here where Sheldon and Kyle give updates on the charts and trades from The Daily Candle newsletter!