

📈📉 360% Potential Gains on THIS Layer-1 Altcoin!
📈📉 360% Potential Gains on THIS Layer-1 Altcoin!
NEAR Heading as HIGH as $31?
Overview
Chart #1 - Polkadot (DOTUSDT) 12-Hour
Chart #2 - Near (NEARUSDT) 8-Hour
Chart #3 - Arweave (ARUSDT) 8-Hour
Chart #4 - Ethereum (ETHUSDT) Daily
Chart #5 - Fear and Greed Index
Chart #1 - Polkadot (DOTUSDT) 12-Hour
Chartist: Sheldon
(For the chart screenshot, click here.)
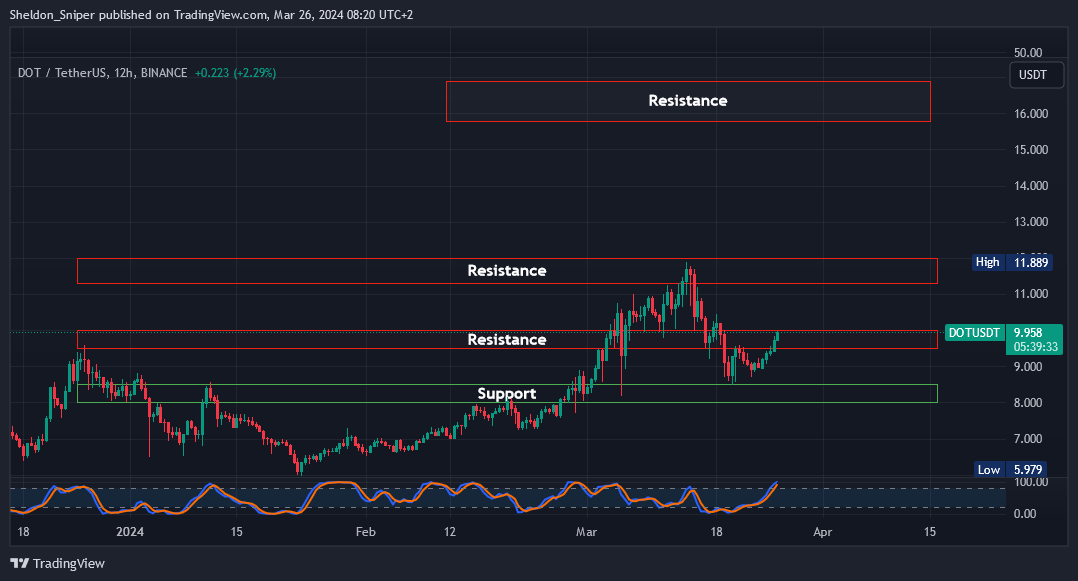
DOT is attempting to break through the $10.00 level of resistance. A break and a retest of this level on a 4HR candle will be a great signal to enter a trade which we can take on Bybit.
Entry: Enter a long spot trade at the break and retest of the $10.00 level.
TP1: $11.30 - $12.00 (13% - 20%)
TP2: $16.00 - $17.00 (60% - 70%)
Stop Loss: Just below $9.50
Chart #2 - Near (NEARUSDT) 8-Hour
Chartist: Kyle
(For the chart screenshot, click here.)
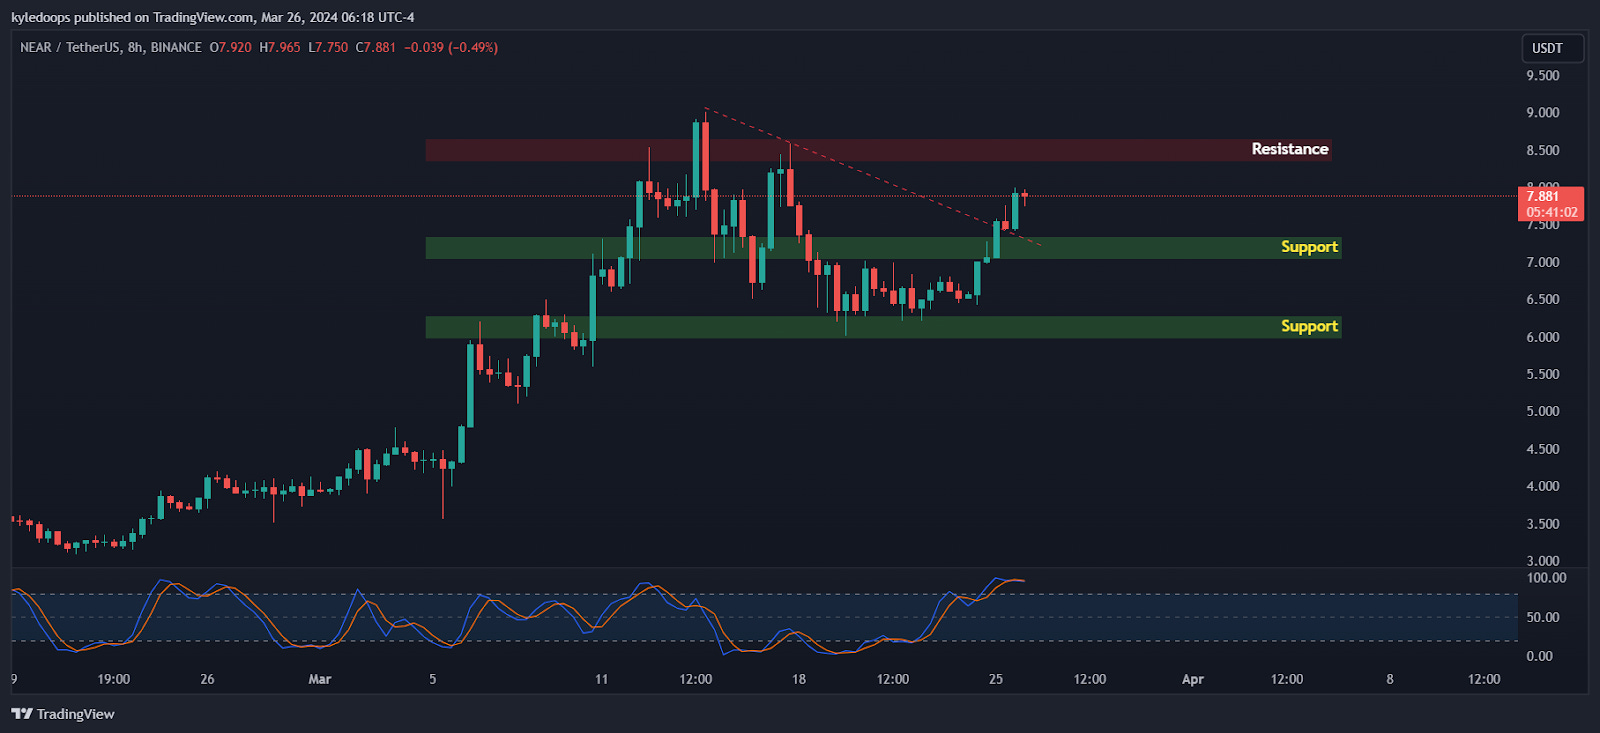
NEAR breaking and holding above $7.3 is very bullish in the long term, as it opens up the range towards its all-time high. Holding that level on the daily confirms the deviation below as a liquidity-sweep. We will take the NEAR trade on Bitget.
Entry: $7.4 to $8.5
TP1: $11.50
TP2: $15 to $17
TP3: $31
Stop Loss: Close below $6

Outsmart 99% Of The Market!
Get full access into our Discord And Telegram group, where you'll find all of our premium content!
👉 Trade Signals!
👉 Trade Set-Ups!
👉 Trading Challenges!
👉 Education!
👉 SO MUCH MORE!
Chart #3 - Arweave (ARUSDT) 8-Hour
Chartist: Kyle
(For the chart screenshot, click here.)
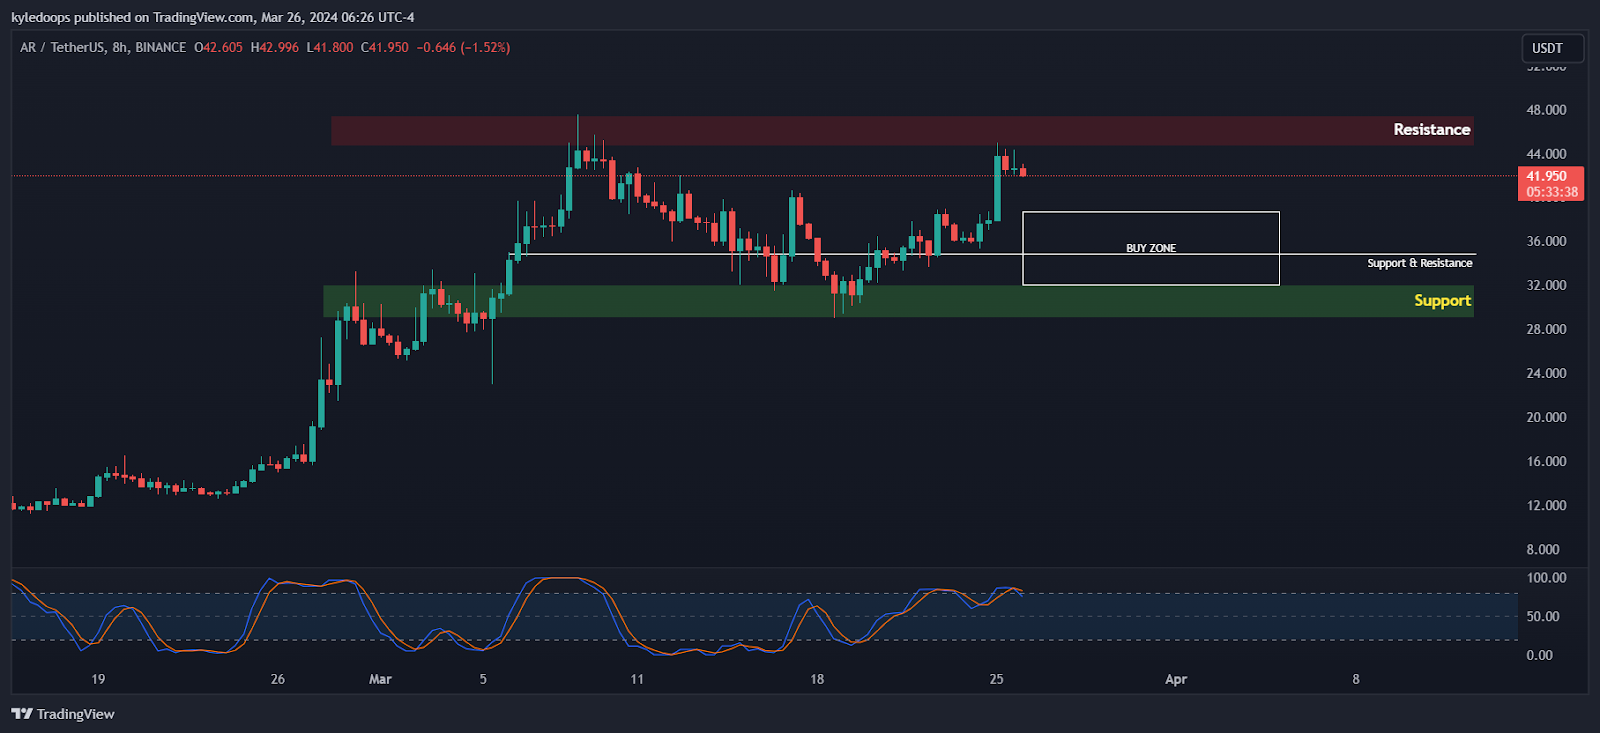
AR has performed very well so far this bull run, up 300% from our original entry on Bitget.
It is currently pushing into a high time frame resistance level at $44 where I am expecting a short term pullback into our buy zone. Clearing the zone will open AR into a range toward its all-time high.
Entry: Spot between $33 to $38
TP1: $54
TP2: $69
TP3: $109 (Moonshot)
Stop Loss: A daily close below $28
Chart #4 - Ethereum (ETHUSDT) Daily
Chartist: Sheldon
(For the chart screenshot, click here.)
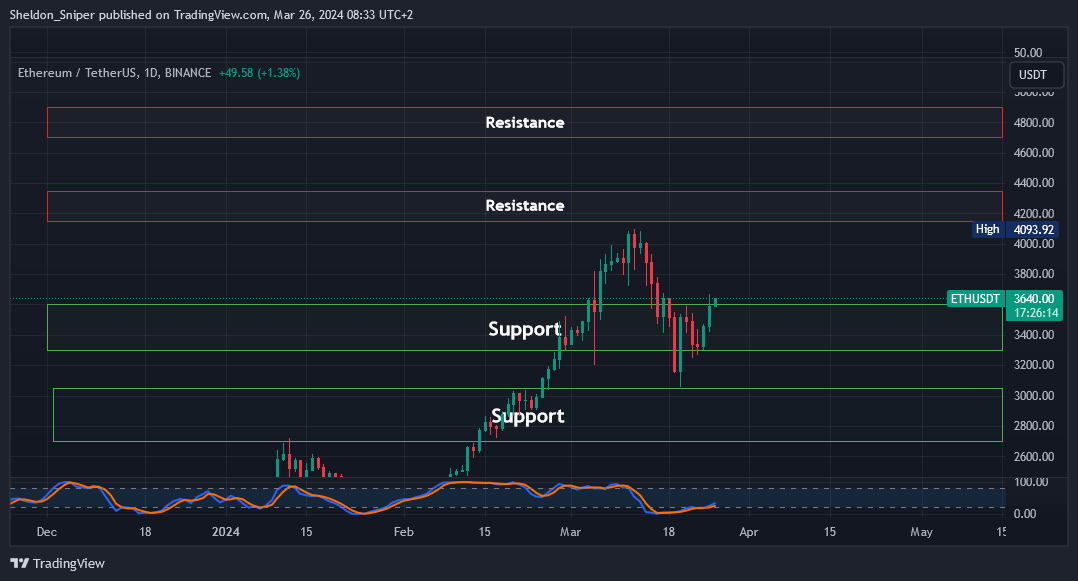
ETH is trying to break through $3,600 (resistance). Once it does, we can trade it on Bitget:
Entry: Enter on an open and close of a 4HR candle above $3,600.
TP1: $4,150 - $4,350 (15% - 21%)
TP2: $4,700 - $4,900 (31% - 36%)
Stop Loss: A deeper stop loss just below $3,300
Chart #5 - Fear and Greed Index
The Fear and Greed Index is sitting at 81 today, indicating Extreme Greed.
The highest the index has been over the past seven days is 81, and the lowest is 73.

Banter’s Take
BTC was able to hold the $66,800 level and push back above $70,000.
As long as BTC holds above $69,000, we can expect alts to perform. The best scenario is that BTC now ranges between $69,000 and $75,000, allowing ETH to breakout, which will lead to the next phase of the bull run.
Stay safe my friends!
Go to our Crypto Banter Discord here where Sheldon and Kyle give updates on the charts and trades from The Daily Candle newsletter!