

📈📉 +457% GAINS with THIS L1 Trade!
📈📉 +457% GAINS with THIS L1 Trade!
CAUTION: Bitcoin Could Dip Lower!
Overview
Chart #1 - Injective (INJUSDT) 8-Hour
Chart #2 - Kaspa (KASUSDT) Daily
Chart #3 - Filecoin (FILUSDT) 8-Hour
Chart #4 - Cosmos Hub (ATOMUSDT) Daily
Chart #5 - Fear and Greed Index
Chart #1 - Injective (INJUSDT) 8-Hour
Chartist: Sheldon
(For the chart screenshot, click here.)
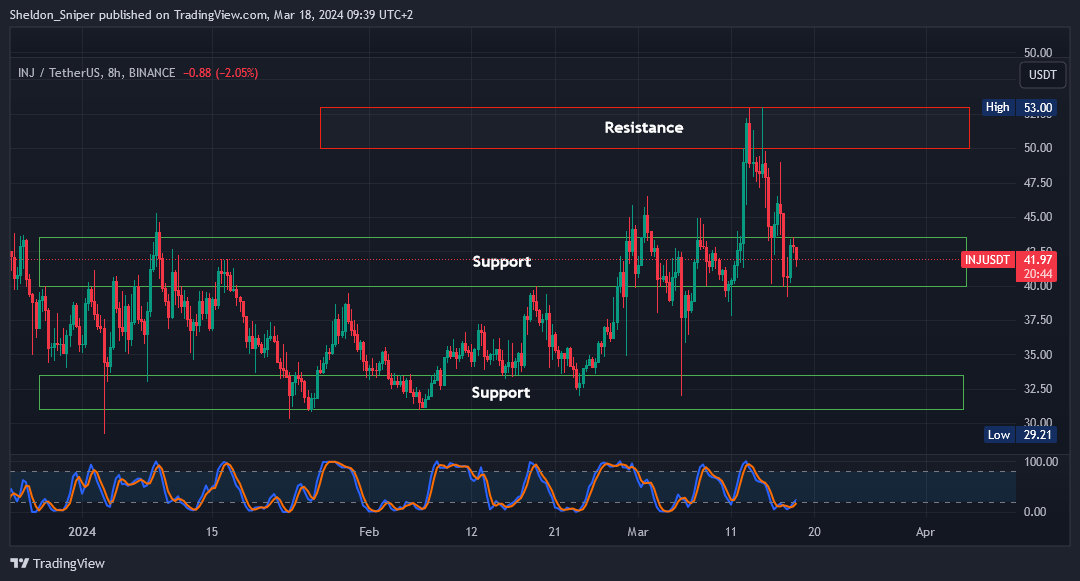
INJ has been very bullish over the last few months. Price has now retraced into an area of support, where I am entering a long trade.
Entry: Ladder into a spot long trade in the current $40.00 - $43.50 area of support.
TP: Take profit at the next area of resistance, which is from $50.00 - $53.00 (25% - 33%)
Stop Loss: A tight stop loss at just below $39.00
I have placed a tight stop loss as BTC might dip lower over the next couple of days, bringing INJ down with it.
Sign-up and trade on Bybit today.
Exclusive $30,000 deposit rewards and bonuses up for grabs!
Chart #2 - Kaspa (KASUSDT) Daily
Chartist: Kyle

(For the chart screenshot, click here.)
KAS is in a trend to the downside and retracing into a key support.
We’ll observe price action in this zone and look to buy on any sign of strength, while still leaving room in the allocation to DCA at lower levels.
Entry 1: $0.12
Entry 2: $0.8 to $0.1
Soft Stop: Daily close below $0.1
Hard Stop: Daily close below $0.08
Claim your Bitget sign-up bonuses here (details below).

Outsmart 99% Of The Market!
Get full access into our Discord And Telegram group, where you'll find all of our premium content!
👉 Trade Signals!
👉 Trade Set-Ups!
👉 Trading Challenges!
👉 Education!
👉 SO MUCH MORE!
Chart #3 - Filecoin (FILUSDT) 8-Hour
Chartist: Kyle
(For the chart screenshot, click here.)
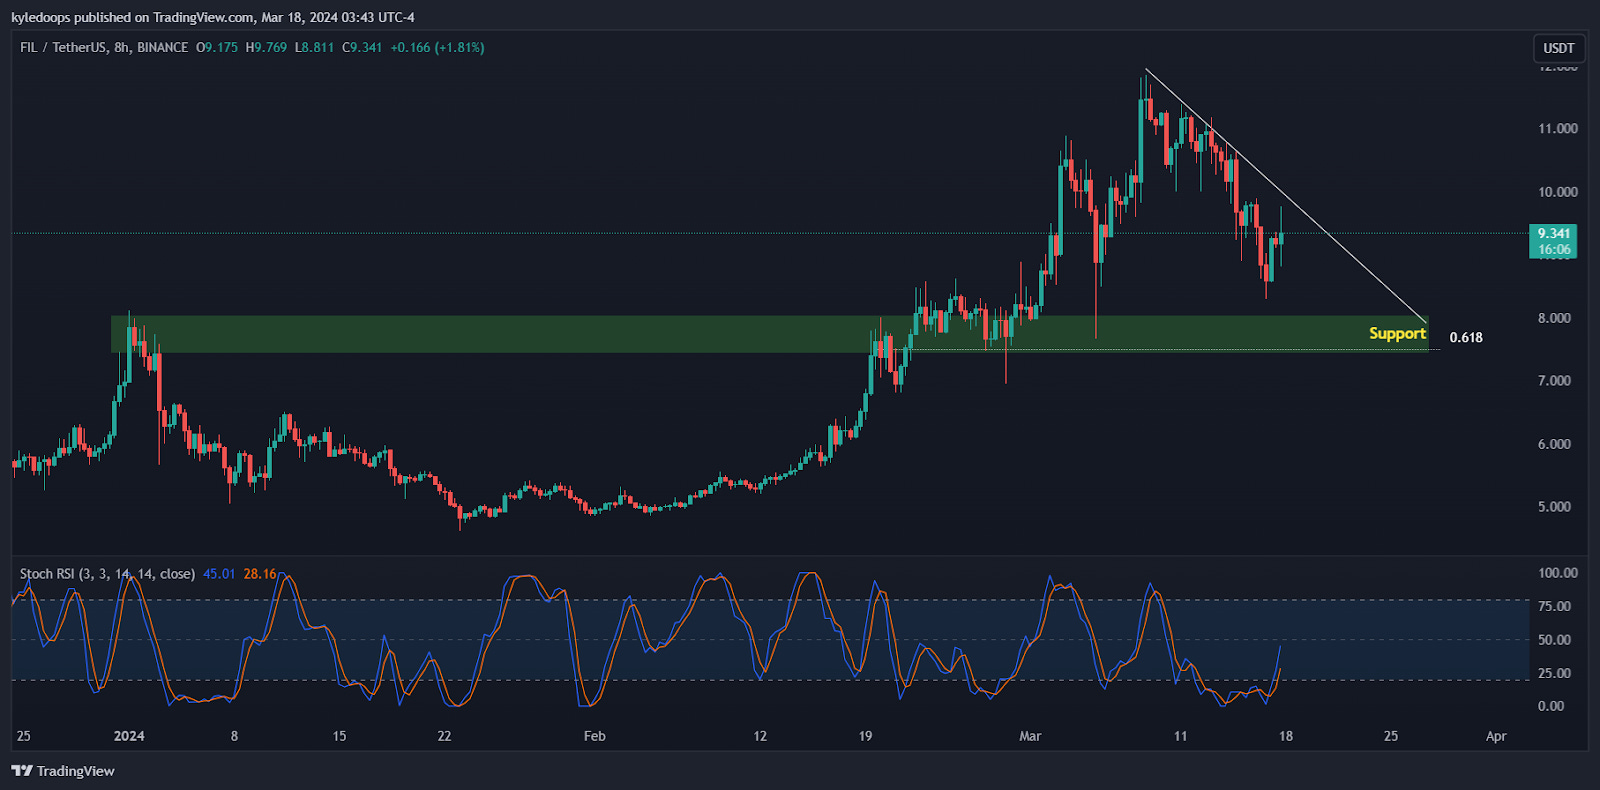
FIL is currently retracing into a key support zone of the Fib 0.618 and previous high time frame resistance. It will be important to observe price as it enters this zone. We’ll look for buying pressure entering the token in this area to trigger spot buying.
Entry: $7 to $8
TP1: $17
TP2 : $25
Stop Loss: Daily close below $6
From $7 to $25 is a 457% gain!
Claim your Bitget sign-up bonuses here (details below).
Chart #4 - Cosmos Hub (ATOMUSDT) Daily
Chartist: Sheldon
(For the chart screenshot, click here.)
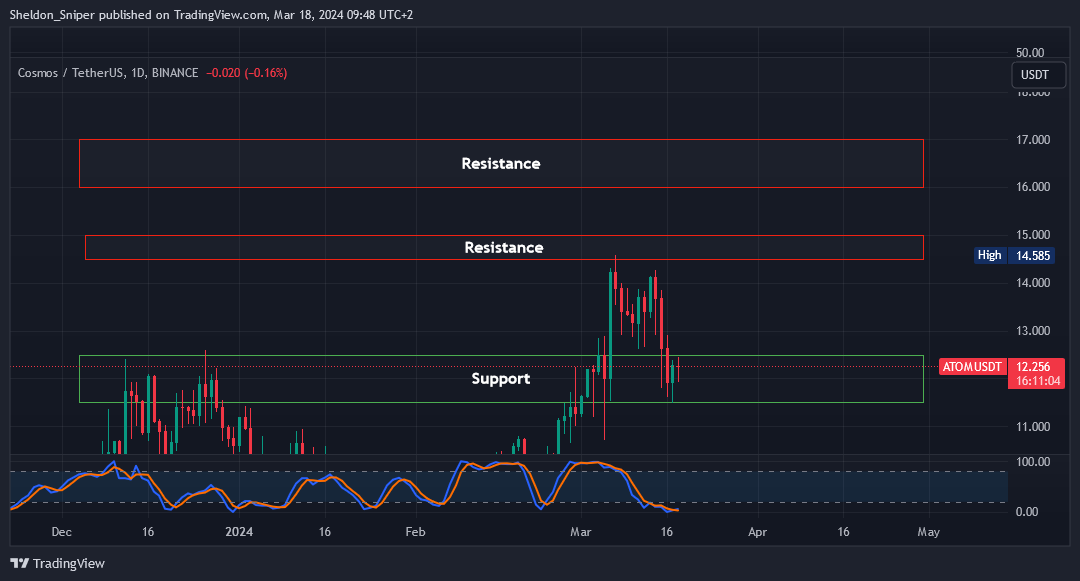
Layer 1 coins have been performing very well over the last couple of weeks, and with the price of ATOM currently trading in an area of support, I am looking at entering into a long trade.
Entry: Ladder into a spot long trade in the current $11.50 - $12.50 area of support.
TP: Take profit at the next areas of resistance,
TP1: $14.50 - $15.00 (26% - 30%)
TP2 : $16.00 - $17.00 (39% - 48%)
Stop Loss: A tighter stoploss at just below $11.00
I have placed a tight stop loss as BTC might dip lower over the next couple of days, bringing ATOM down with it.
Claim your Bitget sign-up bonuses here (details below).
Chart #5 - Fear and Greed Index
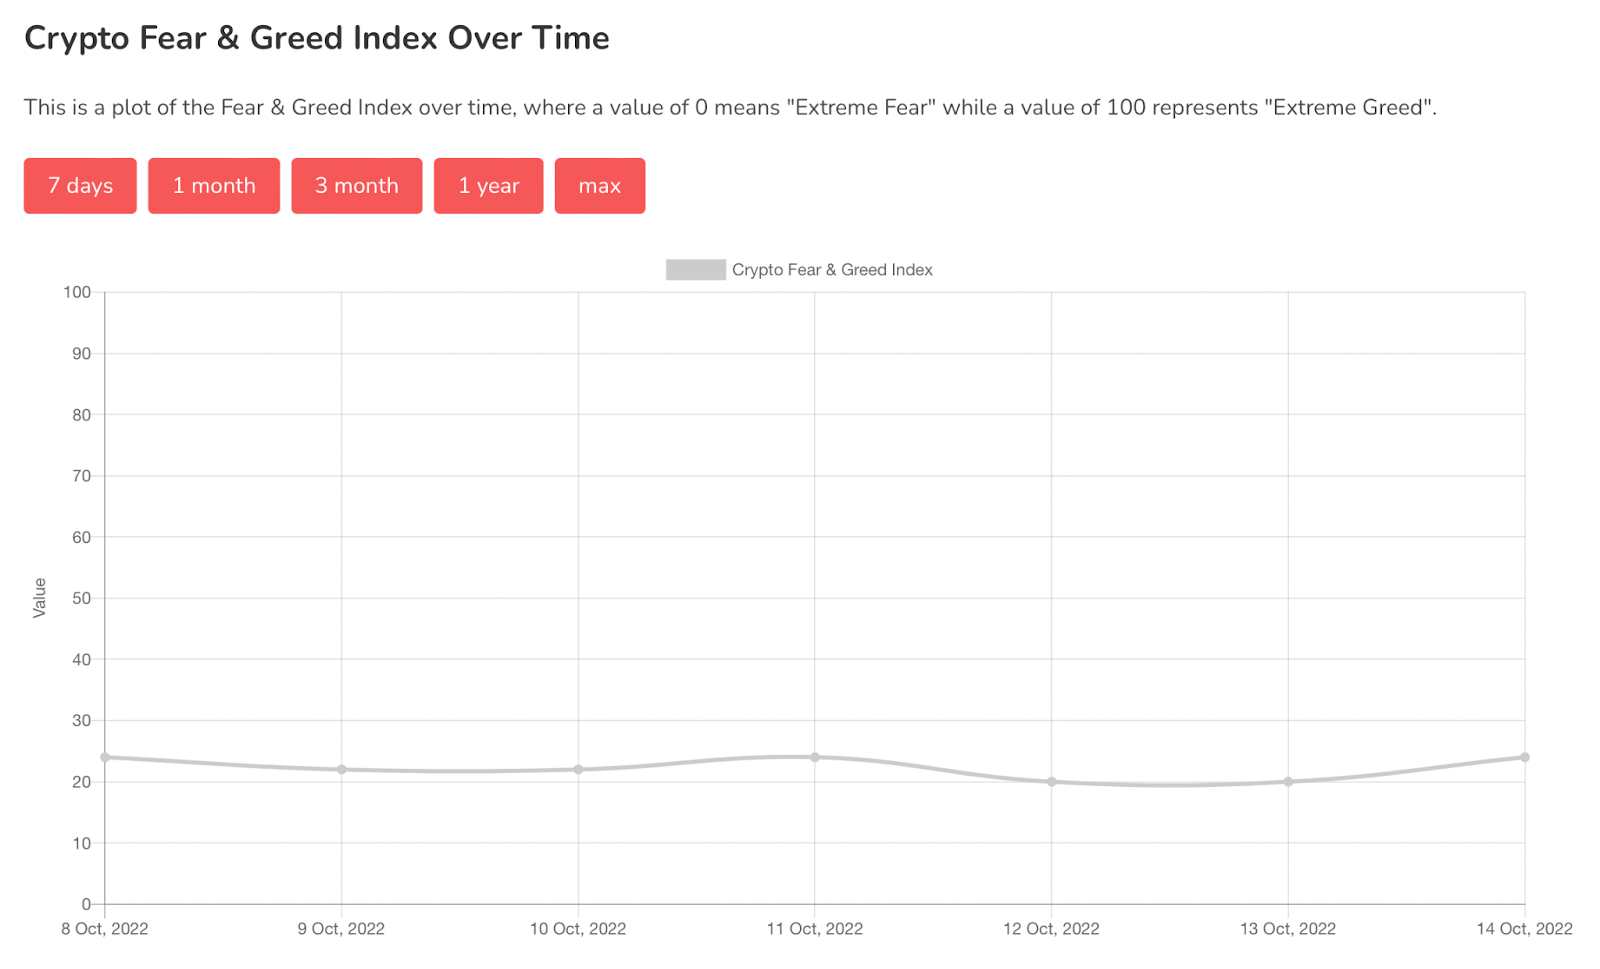
The Fear and Greed Index is sitting at 77 today, indicating Extreme Greed.
The highest the index has been over the past seven days is 88, and the lowest is 77.
Banter’s Take
Following on from last weeks comments, we are currently getting a much anticipated pull back in the markets. There is a time in the markets where direction is clear and leverage trading is easy, and there is a time in the markets where we should focus on our spot bags. There is a time in trading to be bold and there is a time to be cautious.
With the current choppy price action let’s zoom out and look to the high time frames for good support zones, remain patient and wait for price to come to us.
Stay safe my friends!
Go to our Crypto Banter Discord here where Sheldon and Kyle give updates on the charts and trades from The Daily Candle newsletter!
thankxxx bro