

📈📉 $46,000 BTC Incoming!
📈📉 $46,000 BTC Incoming!
PLUS: ETH Heading to $3,200!
Overview
Chart #1 - Crypto Total Market Cap (TOTAL) 3-Day
Chart #2 - Bitcoin (BTCUSD) 4-Hour
Chart #3 - Ethereum / Bitcoin (ETHBTC) Daily
Chart #4 - Polkadot (DOTUSDT) Daily
Chart #5 - Fear and Greed Index
Chart #1 - Crypto Total Market Cap (TOTAL) 3-Day
Chartist: Sheldon
(For the chart screenshot, click here.)
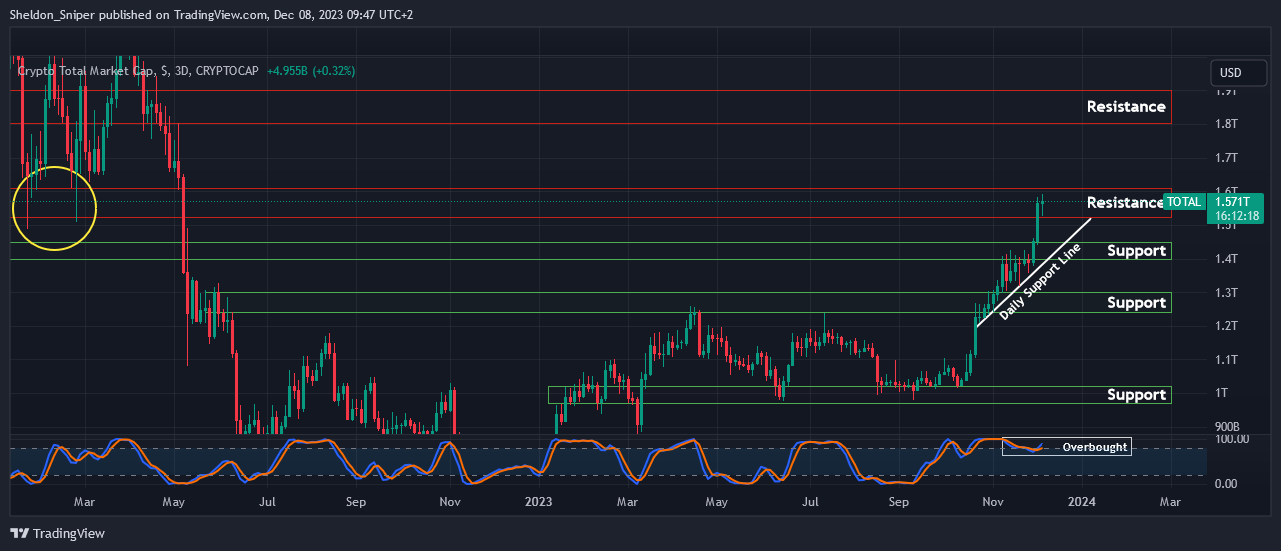
The TOTAL is at $1.52T - $1.60T which held as major support in the beginning quarter of last year, and will now be acting as resistance.
The STOCH RSI is also overbought on higher timeframes, so I expect a pullback soon.
To the downside, the next area of support is at $1.40T - $1.45T.
If the market manages to resume its move to the upside and breaks through the $1.6T level of resistance, the next area of resistance is at $1.8T - $1.9T.
Sign-up and trade on Bybit today.
Exclusive $30,000 deposit rewards and bonuses up for grabs!
Chart #2 - Bitcoin (BTCUSD) 4-Hour
Chartist: Kyle
(For the chart screenshot, click here.)
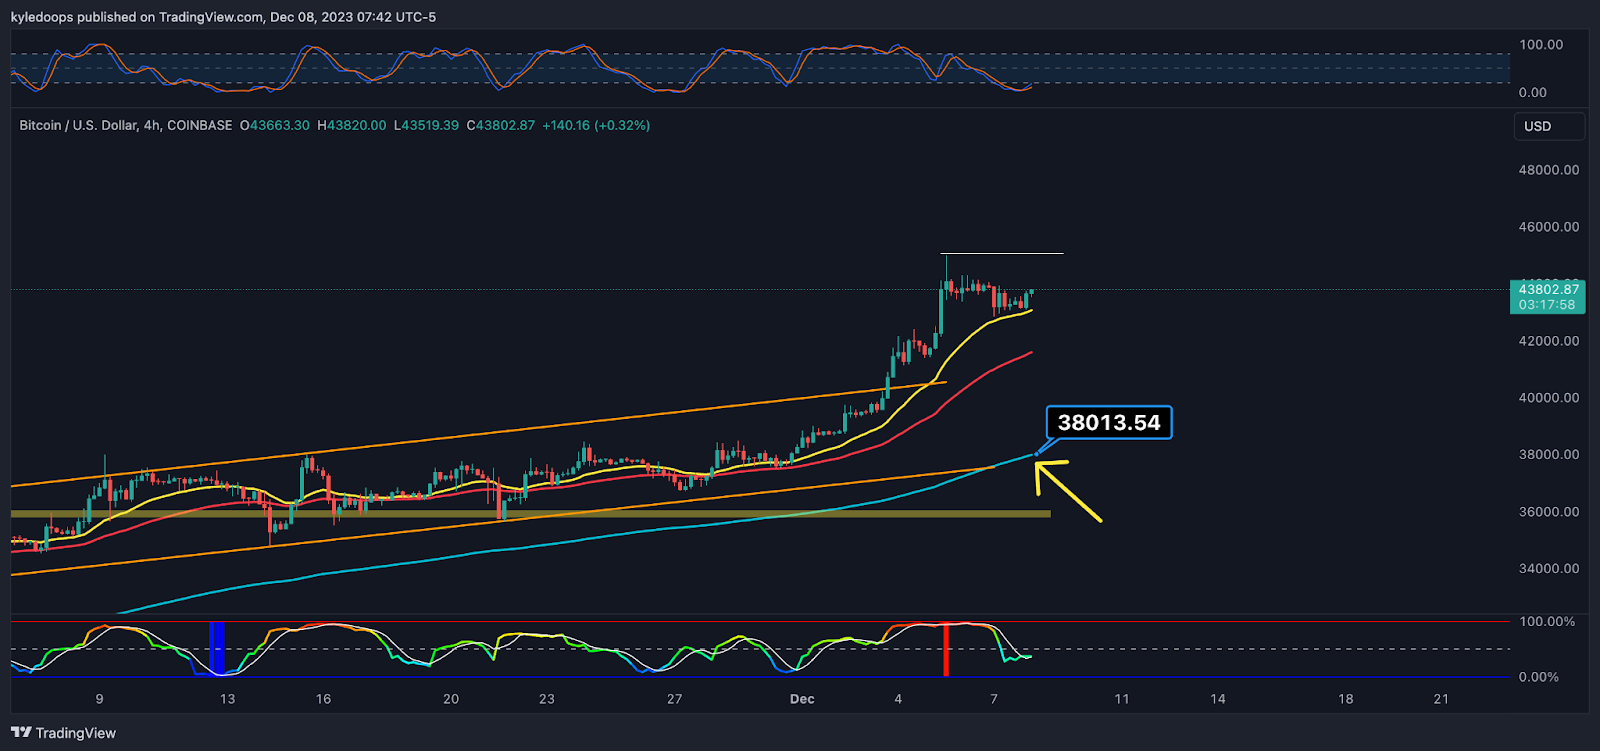
Bitcoin bulls are still entirely in control with prices holding above the 21 EMA (yellow line). The Stochastic RSI has reset and is working its way up to take out the wick high.
This suggests that the next stop is likely $46,000, which is a significant resistance level.
Keep in line with the trend, which is upward.
Claim your Bitget sign-up bonuses here (details below).

Outsmart 99% Of The Market!
Get full access into our Discord And Telegram group, where you'll find all of our premium content!
👉 Trade Signals!
👉 Trade Set-Ups!
👉 Trading Challenges!
👉 Education!
👉 SO MUCH MORE!
Chart #3 - Ethereum / Bitcoin (ETHBTC) Daily
Chartist: Kyle
(For the chart screenshot, click here.)
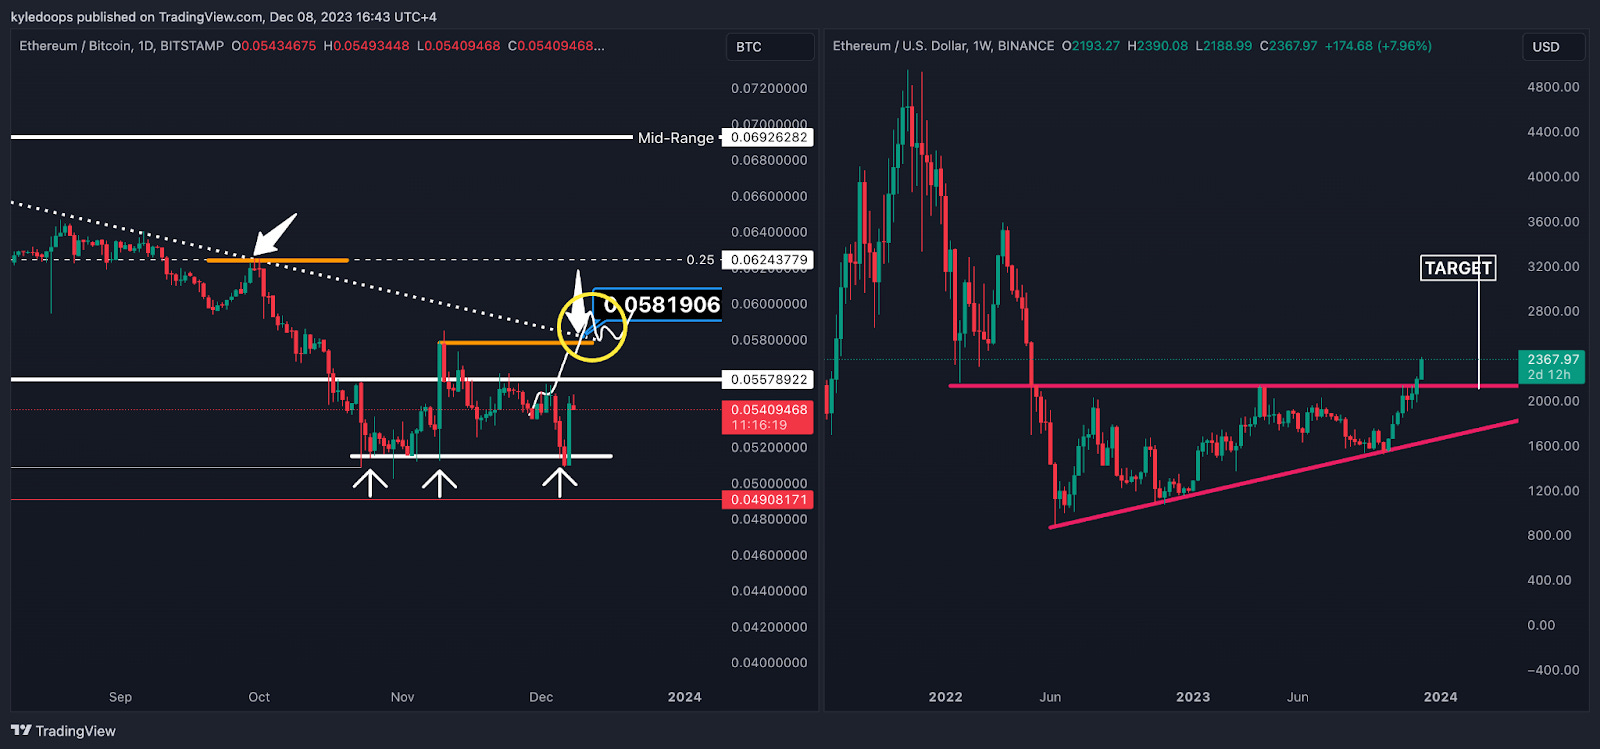
ETH/BTC experienced a big impulsive move up, which led to another expansive move on the ETH/USD weekly candle.
Onwards and upwards is the name of the game.
Technically speaking, Bitcoin is still outperforming ETH, but that trend could very well be nearing its end, and ETH/USD is looking to reach for that $3,200 target level.
Claim your Bitget sign-up bonuses here (details below).
Chart #4 - Polkadot (DOTUSDT) Daily
Chartist: Sheldon

(For the chart screenshot, click here.)
DOT is overbought on higher timeframes and I am expect a pullback with price consolidation between $5.80 - $6.10, before it resumes its trend to the upside.
The next major area of resistance is higher up at $7.00 - $7.30.
Claim your Bitget sign-up bonuses here (details below).
Chart #5 - Fear and Greed Index
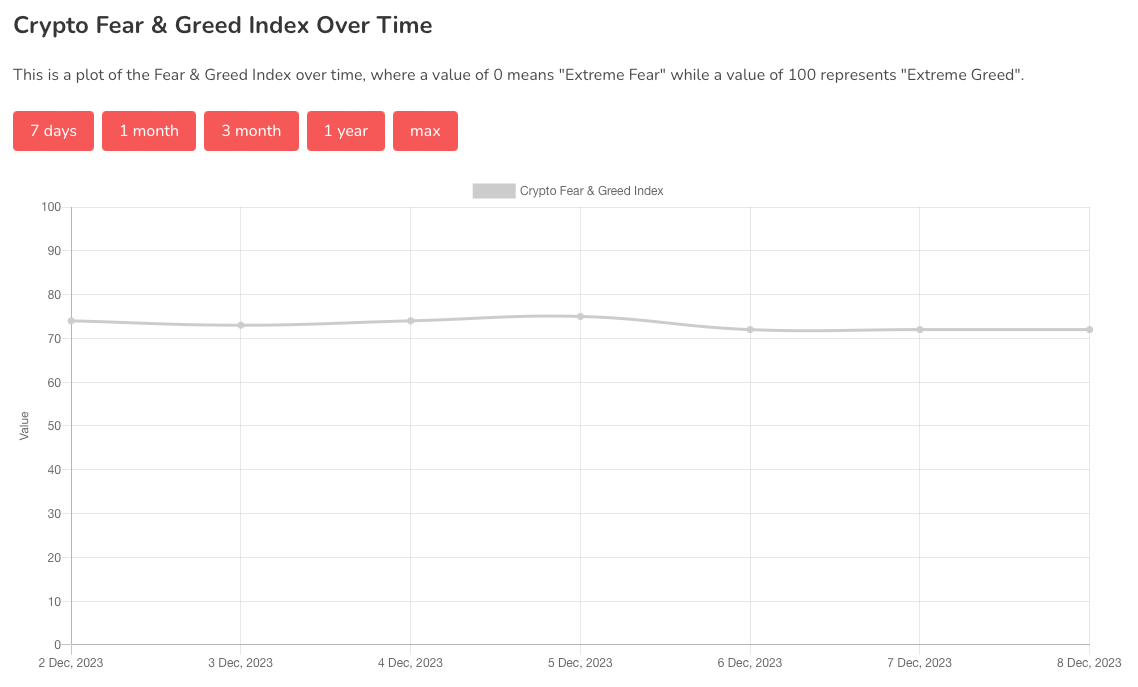
The Fear and Greed Index is sitting at 72 today, indicating Greed.
The highest the index has been over the past seven days is 75, and the lowest is 72.
Banter’s Take
The market is looking good with a fair amount of strength. Bulls keep holding up and remain fully in control. It's best to stick in line with the trend and enjoy the free ride until it ends.
Stay safe my friends!
Go to our Crypto Banter Discord here where Sheldon and Kyle give updates on the charts and trades from The Daily Candle newsletter!