

📈📉 A SOLANA CRASH Could Be IMMINENT! (MASSIVE Trade Opportunity!)
📈📉 A SOLANA CRASH Could Be IMMINENT! (MASSIVE Trade Opportunity!)
PLUS: How To Get 60% Gains on THIS Major Layer-1!
Overview
Chart #1 - Solana (SOLUSDT) Daily
Chart #2 - Pyth Network (PYTHUSD) 12-Hour
Chart #3 - Avalanche (AVAXUSDT) 12-Hour
Chart #4 - Theta Network (THETAUSDT) Daily
Chart #5 - Fear and Greed Index
Chart #1 - Solana (SOLUSDT) Daily
Chartist: Sheldon
(For the chart screenshot, click here.)
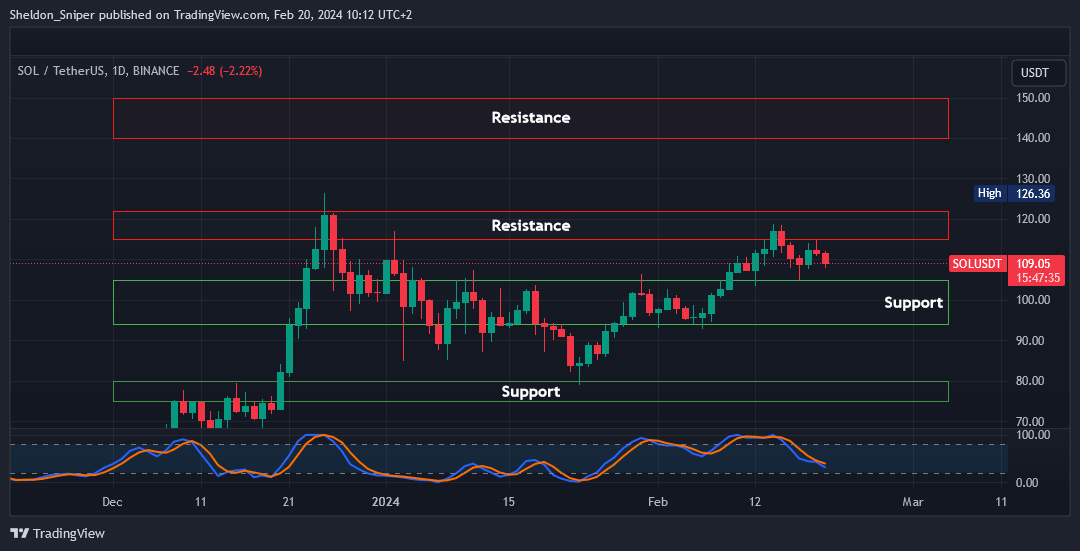
Many alts are at major resistance levels, showing retracement or sideways consolidation below resistance.
Last week, SOL was rejected around $120 and has since retraced to its current trading price of around $109.00. The $105.00 level is holding as support, but there's potential for further market correction in the next week, possibly leading to a deeper correction for SOL, even testing the bottom range level of support at around $94.50.
If the price retraces to this level, I'll be interested in taking a long position, with a plan to take profit in the $140 – $150 resistance area.
My stop loss will be set just below $90.00.
It’s a great opportunity to make nice gains. Head over to Bybit and get set up! If the dip comes, you will want to be ready!
Chart #2 - Pyth Network (PYTHUSD) 12-Hour
Chartist: Kyle
(For the chart screenshot, click here.)
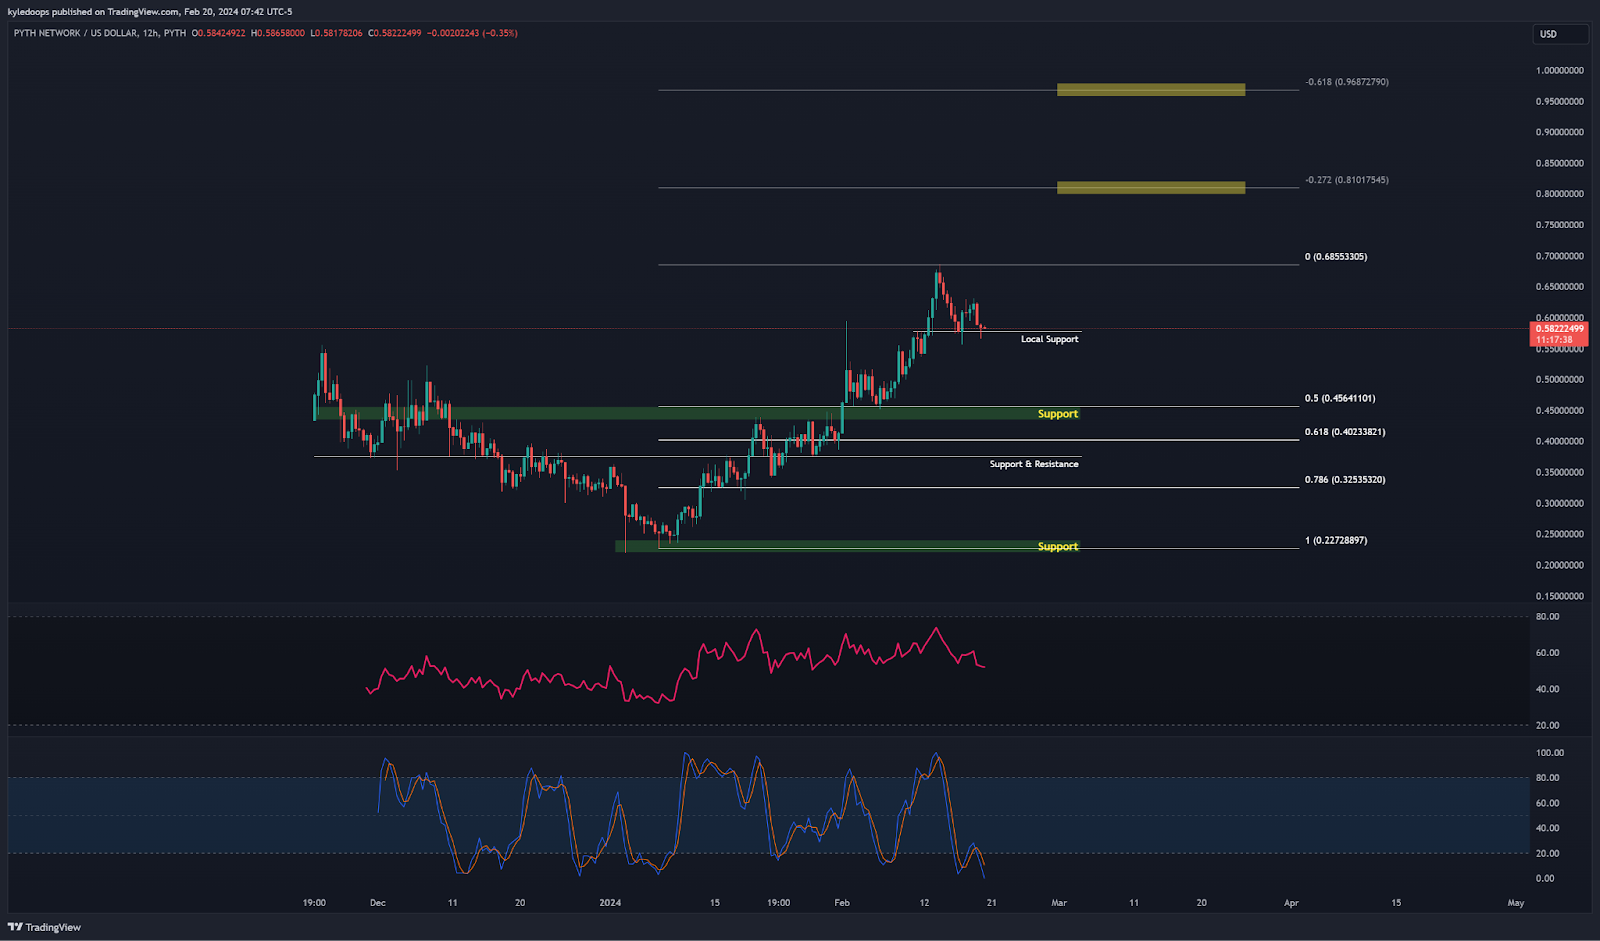
Since the start of 2024, the PYTH has been on a solid, strong, and healthy uptrend and is currently building support where this same area previously acted as resistance.
The next possible resistance areas for profit-taking are $0.81 and $0.96.
Heading into the bull market, these are opportunities we can’t miss. Create a Bitget trading account here, give it all you’ve got, and change your life forever!

Outsmart 99% Of The Market!
Get full access into our Discord And Telegram group, where you'll find all of our premium content!
👉 Trade Signals!
👉 Trade Set-Ups!
👉 Trading Challenges!
👉 Education!
👉 SO MUCH MORE!
Chart #3 - Avalanche (AVAXUSDT) 12-Hour
Chartist: Kyle
(For the chart screenshot, click here.)
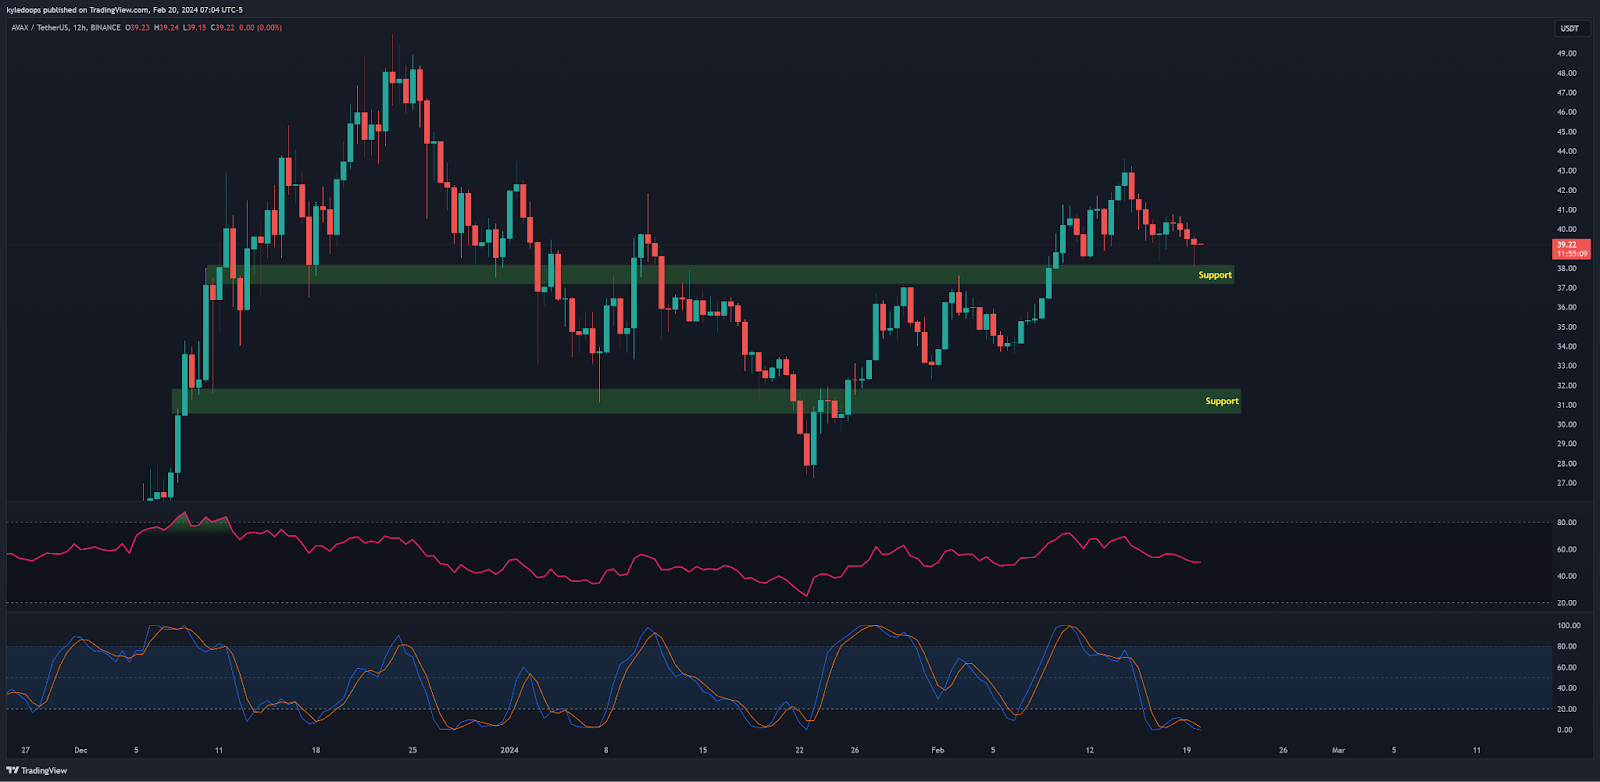
AVAX has turned the resistance into support and is building a structure, providing a solid foundation for the next upward movement.
An entry above $38.15 seems promising, with the next resistance level at $46.20, offering a potential gain of 20%.
On a 3x leverage that’s 60% gains. Head over to Bitget if you don’t want to miss out!
Chart #4 - Theta Network (THETAUSDT) Daily
Chartist: Sheldon
(For the chart screenshot, click here.)
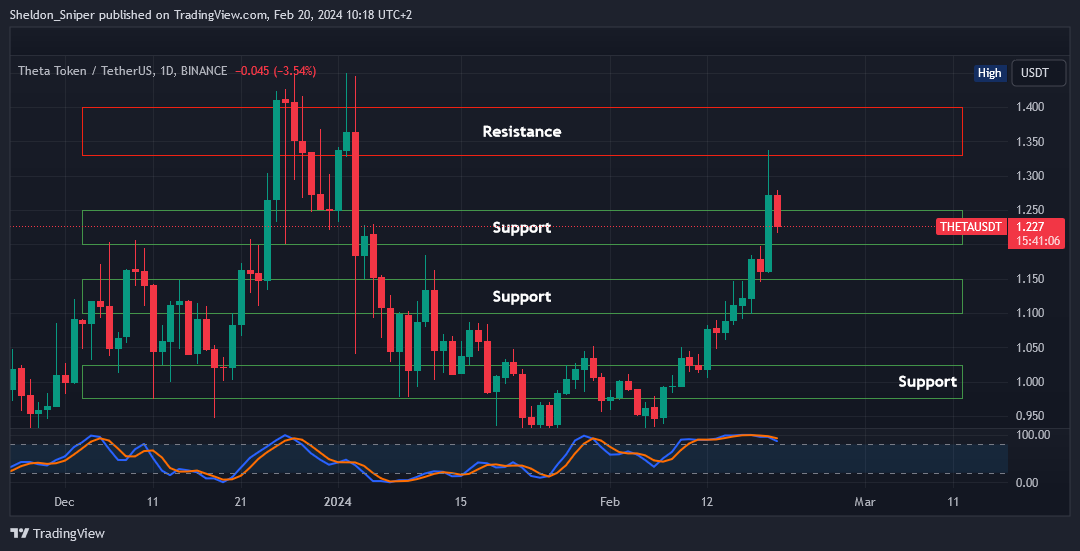
THETA's surged by over 30% in the last two weeks, moving from $0.95 to a rejection level last night at around $1.325.
The price has begun to correct, and I anticipate a retracement to around $1.10 in the next week or two.
If the $1.10 level holds, a spot long trade could be in play, with the goal of taking some profit at around $1.325 to $1.40, and letting the remainder ride to the next resistance area at around $1.60.
My stop loss would be set just below $1.05. Set all the levels and alerts now on Bitget so you don’t miss the trade when it comes!
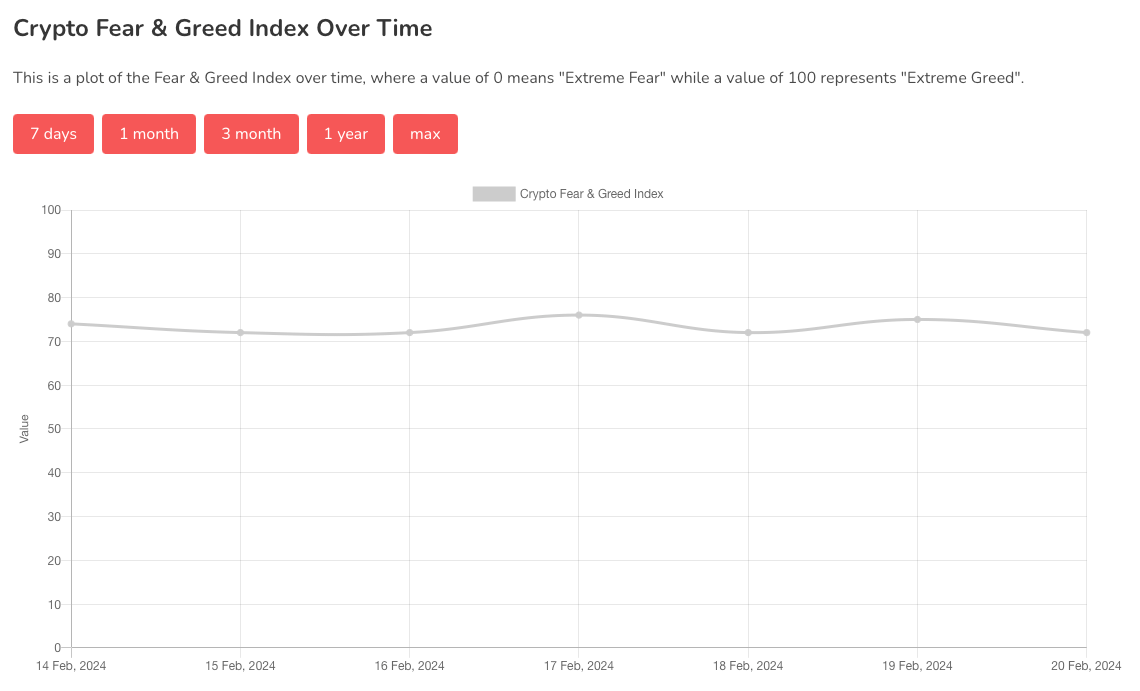
Chart #5 - Fear and Greed Index
The Fear and Greed Index is sitting at 72 today, indicating Greed.
The highest the index has been over the past seven days is 76, and the lowest is 72.
Banter’s Take
Bitcoin is currently ranging between $52,800 and $51,200, providing Ethereum the opportunity to climb towards the $2,900 region. Please exercise caution, as the FOMC meeting is scheduled for tomorrow, which may induce volatility later today and tomorrow.
Stay safe my friends!
Go to our Crypto Banter Discord here where Sheldon and Kyle give updates on the charts and trades from The Daily Candle newsletter!