

📈📉 After THIS, We SHORT the Australian Dollar!
📈📉 After THIS, We SHORT the Australian Dollar!

Overview
Chart #1 - U.S. Dollar (DXY) Daily Chart
Chart #2 - Ethereum (ETHUSD) Daily Chart
Chart #3 - Australian Dollar (AUDUSD) Hourly Chart
Chart #4 - Bitcoin (BTCUSDT) Daily Chart
Chart #5 - Fear and Greed Index

Chart #1 - U.S. Dollar (DXY) Daily Chart
Chartist: Sheldon

(For the chart screenshot, click here.)
After breaking through the daily descending resistance line last week, the DXY has now reached the 104.00 - 104.50 area of resistance.
There could be a rejection here, sending it down to 103.50, where the next level of support can be found.
A weaker US Dollar will be bullish for risk-on assets, including stocks and crypto. If the DXY continues to strengthen from here and breaks through 104.50, the next resistance is at 105.00, followed by 106.00.
𝗣𝗿𝗶𝗺𝗲 𝗫𝗕𝗧
Sign up for a new Trading Account on Prime XBT!
Receive a deposit bonus of up to $7,000 with promo code: SheldonSniper
Sign-up and trade on Bybit today.
Exclusive $30,000 deposit rewards and bonuses up for grabs!
Chart #2 - Ethereum (ETHUSD) Daily Chart
Chartist: Kyle

(For the chart screenshot, click here.)
ETH is currently holding support, but only just; a break below the pivot level of $1,645 will ultimately lead to prices heading towards the $1,400 level.
It's possible there is a short squeeze first before any further downside, at which point the bounce likely fails around $1,820.
𝗣𝗿𝗶𝗺𝗲 𝗫𝗕𝗧
Sign up for a new Trading Account on Prime XBT!
Receive a deposit bonus of up to $7,000 with promo code: KyleDoops
Chart #3 - Australian Dollar (AUDUSD) Hourly Chart
Chartist: Kyle
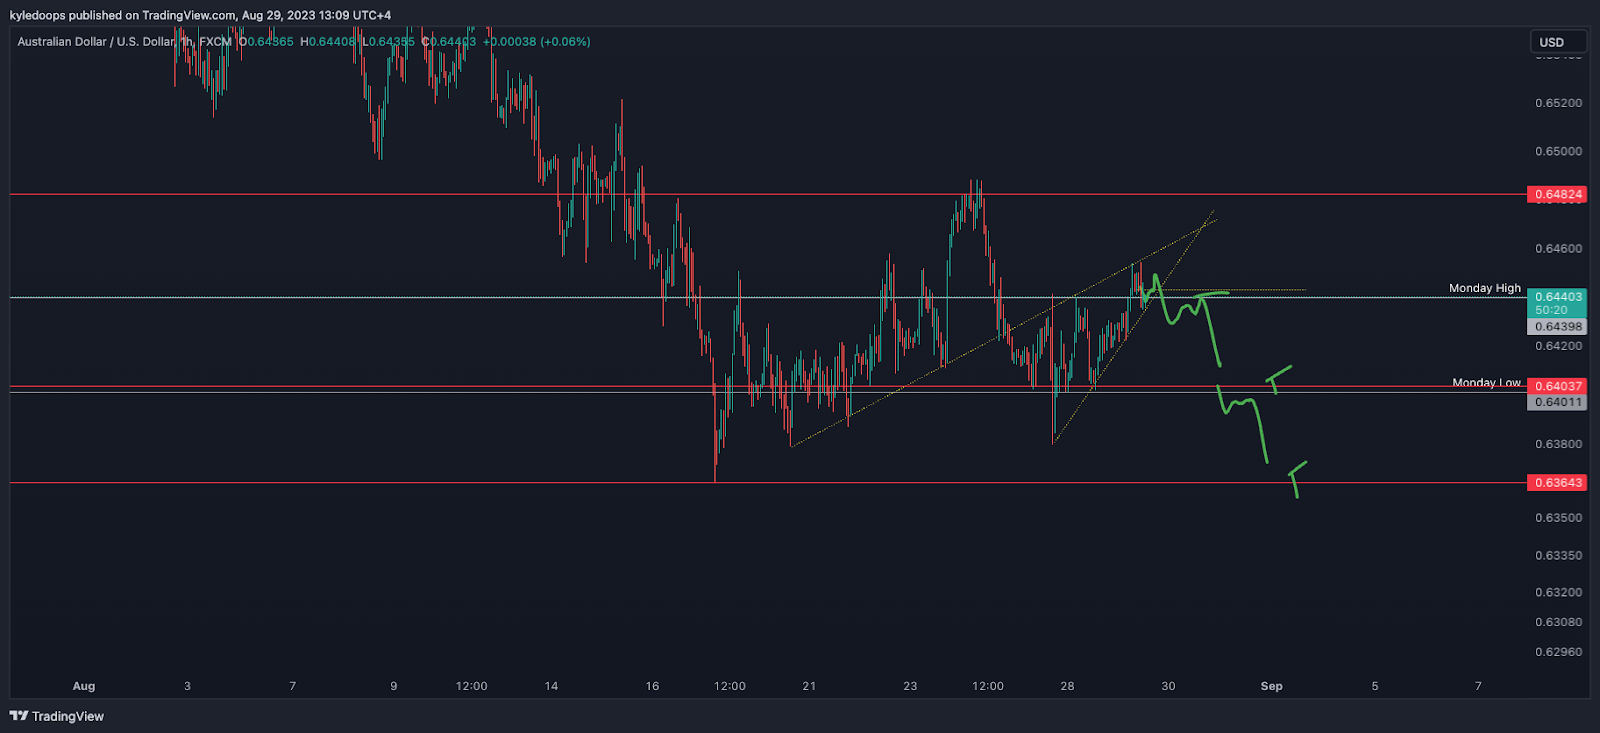
(For the chart screenshot, click here.)
Since the DXY is bullish, most other currencies will likely struggle to move against the dollar. That means that a break of this falling wedge to the downside likely leads to lower prices.
We’ll wait for the price to lose Monday's high, then retest it as resistance before entering a short trade.
Then, we’ll short down to Monday's low as Take Profit 1 (TP1), and then $0.636 as the final TP.
Claim your Bitget sign-up bonuses here (details below).
Chart #4 - Bitcoin (BTCUSDT) Daily Chart
Chartist: Sheldon
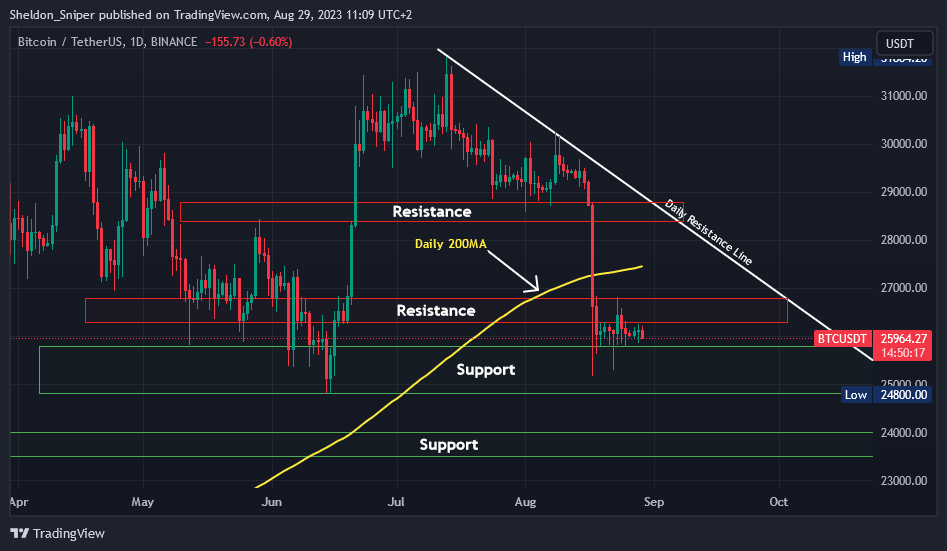
(For the chart screenshot, click here.)
Bitcoin has been consolidating in a tight range for almost two weeks now, between a support low of $25,200 and a range high of around $26,800.
The bulls have not been able to retest the breakdown from the $29,000 support yet.
The longer the price stays in a tight range, the higher the likelihood that there will be a continuation of price to the downside, with the next support at the June low of $24,800, and then the next major area of support at $23,600 - $24,000.
Claim your Bitget sign-up bonuses here (details below).
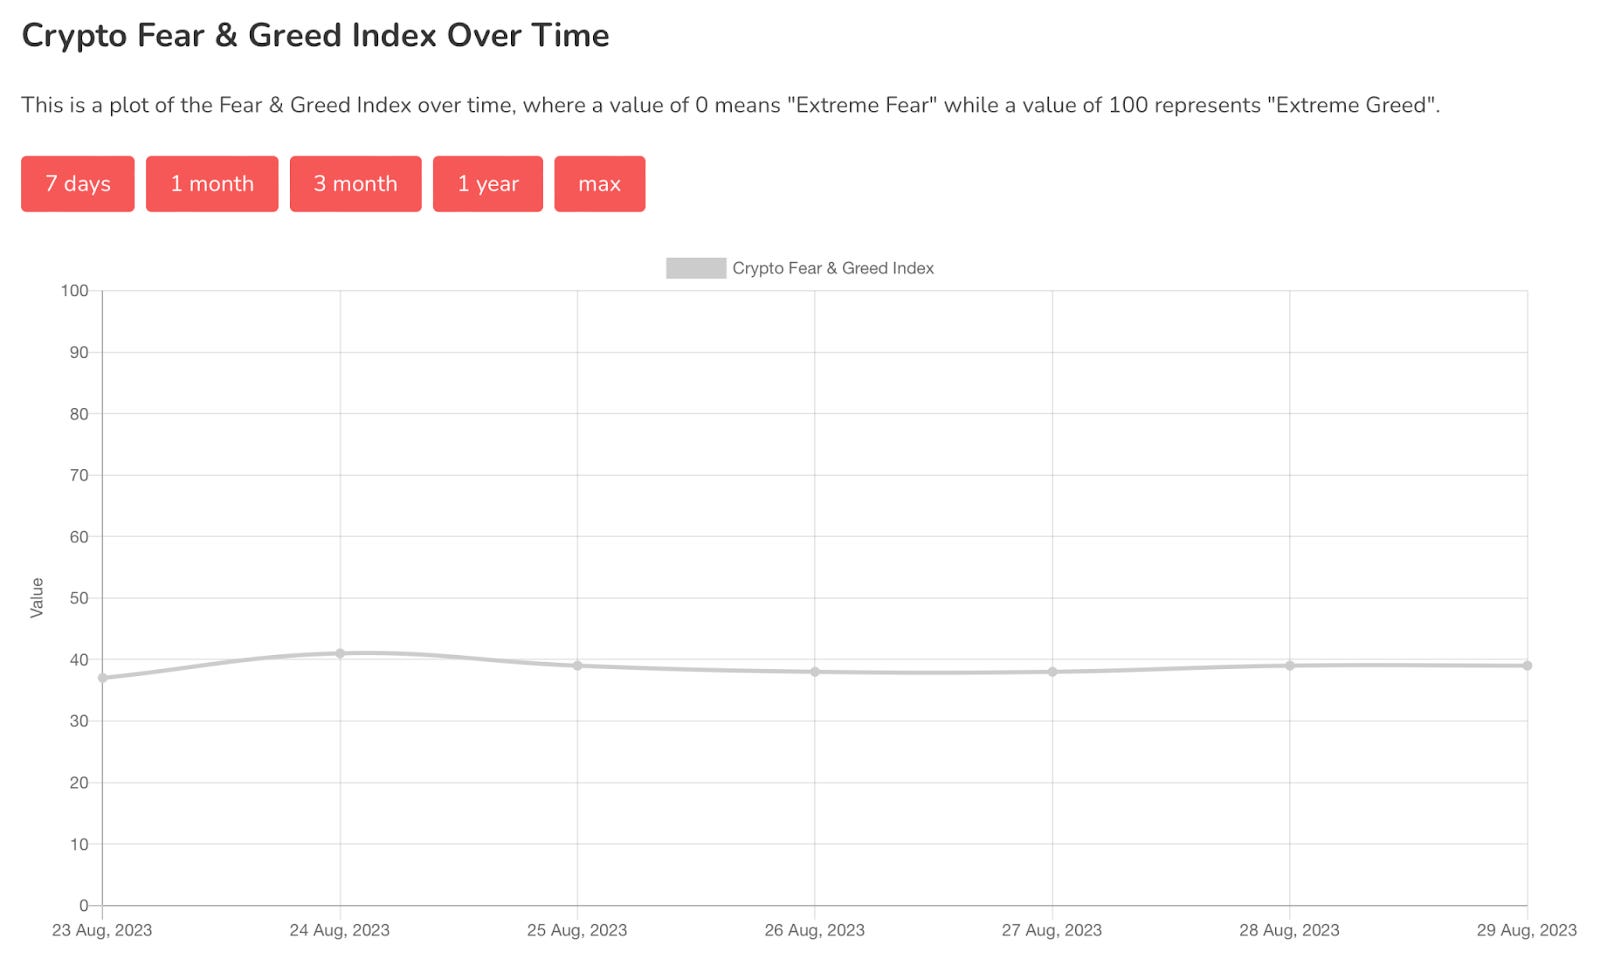
Chart #5 - Fear and Greed Index
The Fear and Greed Index is sitting at 39 today, indicating Fear.
The highest the index has been over the past seven days is 41, and the lowest is 37.
Banter’s Take
Bitcoin continues to consolidate after the flush to the downside. On the low timeframe, the price is creating a bear flag. This means we could see a sweep below the range lows on the low timeframe, that being below $25,000.
Risk still remains to the downside.
Stay safe my friends!
Go to our Crypto Banter Discord here where Sheldon and Kyle give updates on the charts and trades from The Daily Candle newsletter!