

📈📉 ALERT! BTC Crashing Down to $56K?
📈📉 ALERT! BTC Crashing Down to $56K?
PLUS: TWO Altcoin Trades You Don't Want to MISS!
Overview
Chart #1 - Gala (GALAUSDT) 8-Hour
Chart #2 - Sei (SEIUSDT) 12-Hour
Chart #3 - Bittensor (TAOUSDT) Daily
Chart #4 - Bitcoin (BTCUSDT) Daily
Chart #5 - Fear and Greed Index
Chart #1 - Gala (GALAUSDT) 8-Hour
Chartist: Sheldon

(For the chart screenshot, click here.)
GALA is a gaming token and has been performing very well over the last couple of weeks, before it started to correct.
I expect a relief bounce, once BTC finds support.
This is a very risky scalp trade, as BTC could carry on correcting. A tight stoploss is required.
Entry: Enter a long spot trade in the current $0.058 - $0.065 area of support. (Watch BTC closely, to make sure that price has found support, and has stabilised)
TP: 25% at $0.07, and the balance at $0.08. (20% - 38%).
Stop Loss: Just below $0.056
Sign-up and trade on Bybit today.
Exclusive $30,000 deposit rewards and bonuses up for grabs!
Chart #2 - Sei (SEIUSDT) 12-Hour
Chartist: Kyle
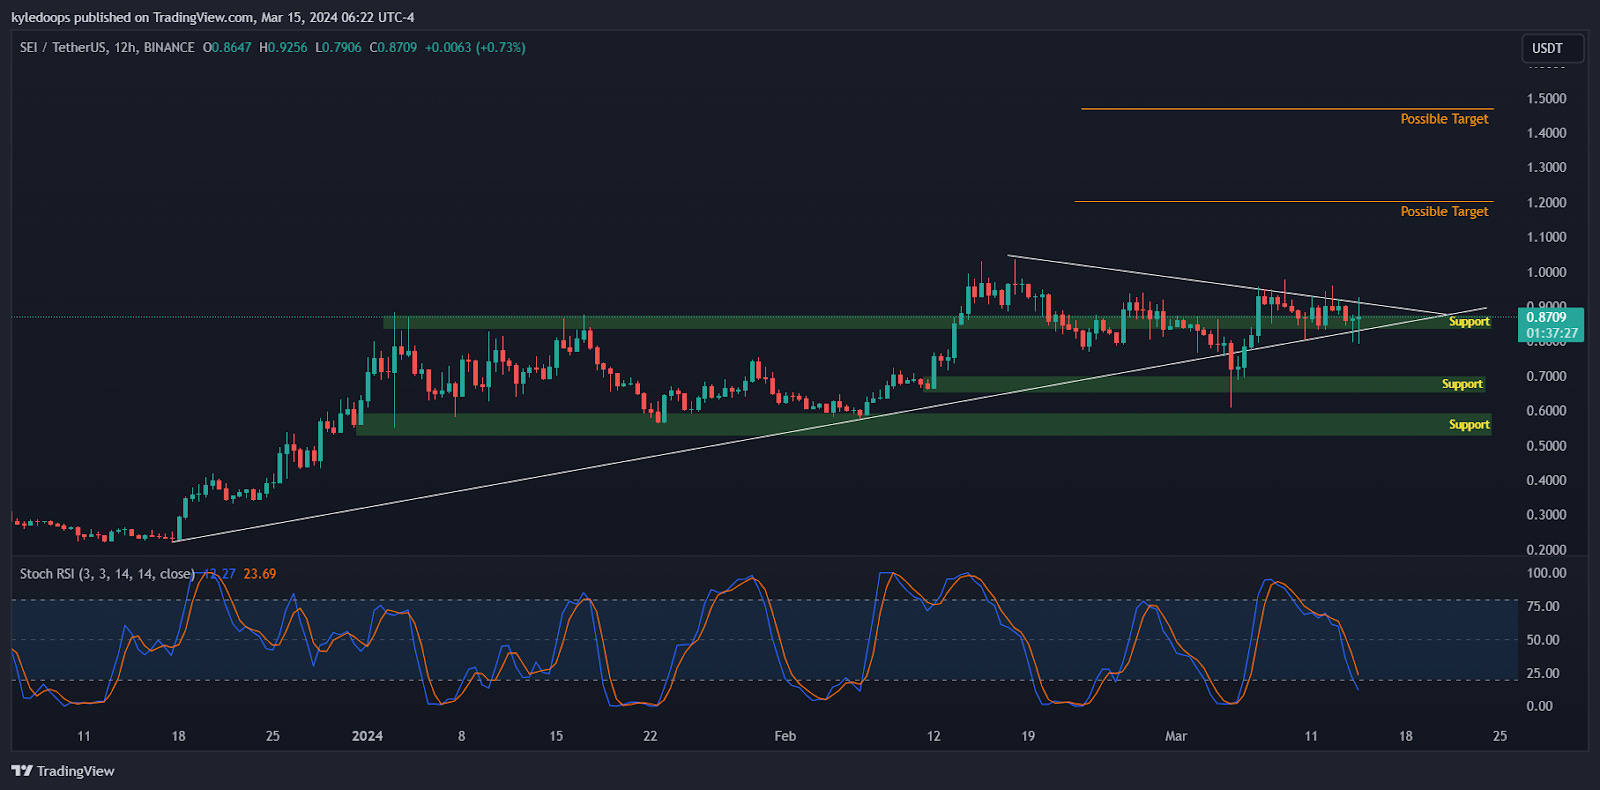
(For the chart screenshot, click here.)
SEI is showing relative strength on the charts compared to other alts during this selloff.
If price finds stability above support look for continuation to create a higher high into price discovery.
Entry: $0.83 to $0.9
TP: $1.2
TP: $1.5
Stop Loss: Loosing $0.68 on the daily close.
Claim your Bitget sign-up bonuses here (details below).

Outsmart 99% Of The Market!
Get full access into our Discord And Telegram group, where you'll find all of our premium content!
👉 Trade Signals!
👉 Trade Set-Ups!
👉 Trading Challenges!
👉 Education!
👉 SO MUCH MORE!
Chart #3 - Bittensor (TAOUSDT) Daily
Chartist: Kyle
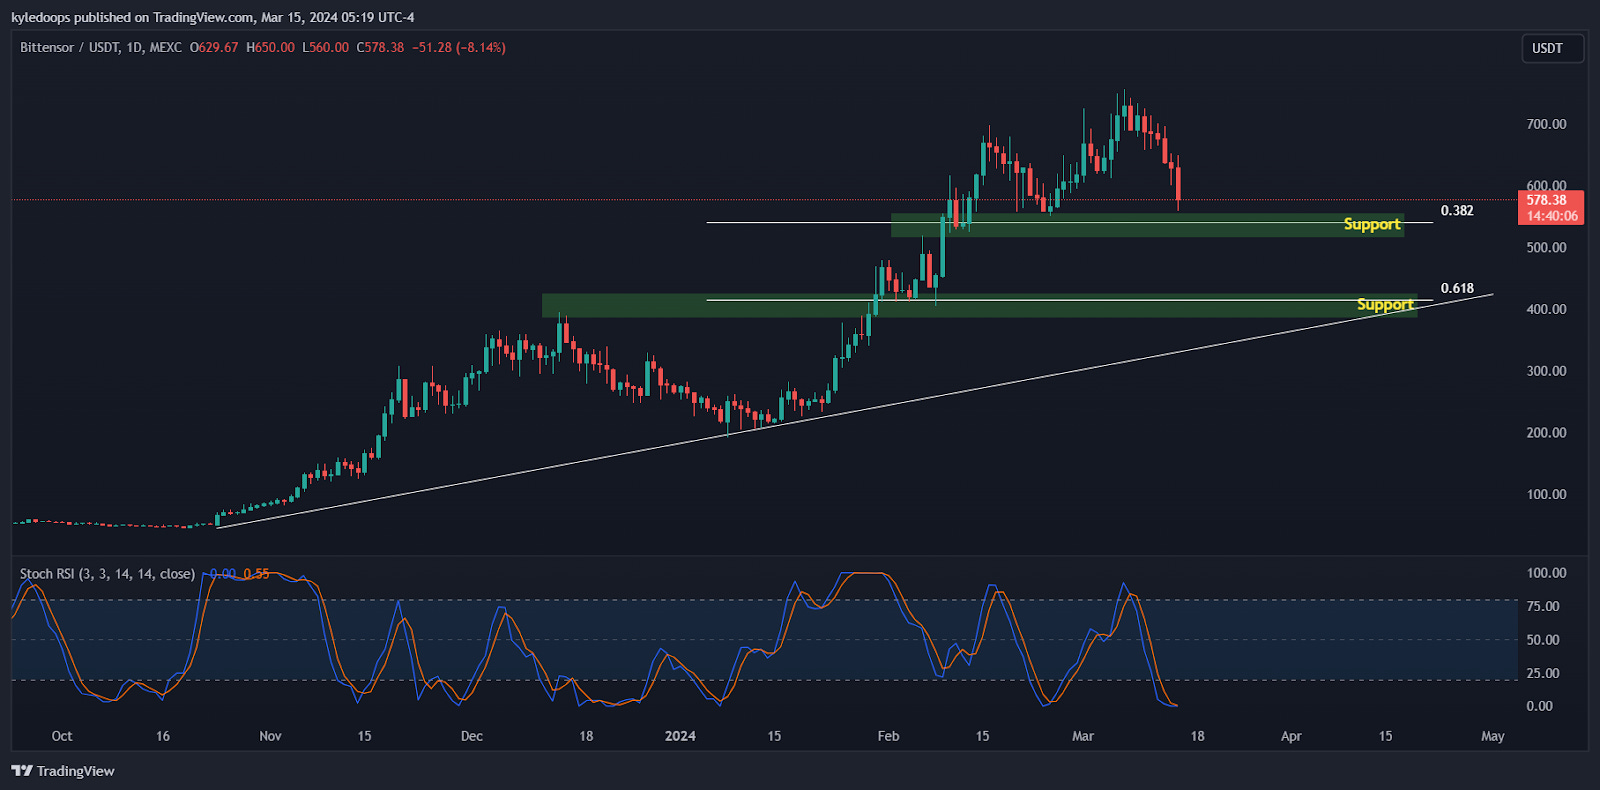
(For the chart screenshot, click here.)
Zoom out and look to the higher timeframes.
What was resistance has become support. TAO has had a fantastic run and is due a retrace into the $400 - $480 zone to complete the wave.
Observe when price reaches here and watch for a change of character and continuation to the upside. Alternatively price acceptance back above $382.
Claim your Bitget sign-up bonuses here (details below).
Chart #4 - Bitcoin (BTCUSDT) Daily
Chartist: Sheldon

(For the chart screenshot, click here.)
BTC got rejected near $73,000, and overnight has started to correct.
It had been running hard over the last few months, without a proper correction. A retrace in the market is healthy in order to take the next leg to the upside. Areas of support to look for a possible bounce are at $65,000, $60,500 and $56,500.
This correction could stagger down and take a couple of weeks to play out, with relief bounces along the way where alts will likely outperform BTC.
Claim your Bitget sign-up bonuses here (details below).
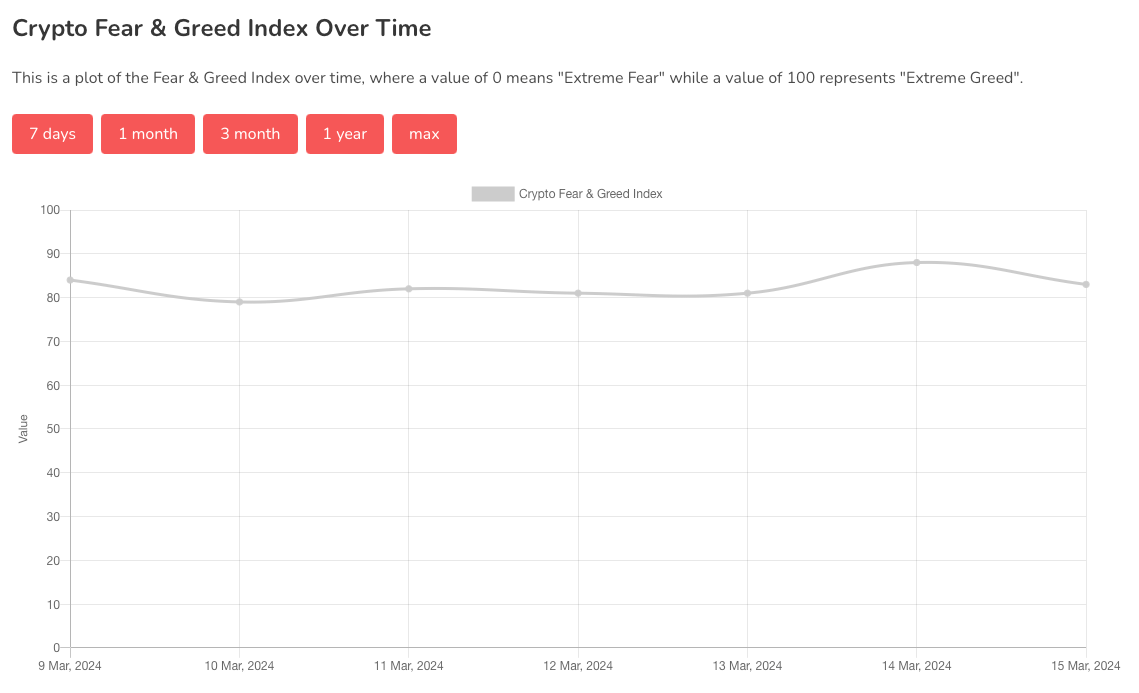
Chart #5 - Fear and Greed Index
The Fear and Greed Index is sitting at 83 today, indicating Extreme Greed.
The highest the index has been over the past seven days is 88, and the lowest is 79.
Banter’s Take
Yesterday the net inflows on BTC were significantly lower which could have led to the selloff today.
Let’s take a quick look at marco where PPI data came out much higher than expected at 0.6%. This ultimately leads the CPI data, and lends fear that inflation is going to remain elevated next week.
For now I expect flushes to create higher lows. Look for areas of interest on the higher timeframes and, when price enters, watch for a change of direction.
Stay safe my friends!
Go to our Crypto Banter Discord here where Sheldon and Kyle give updates on the charts and trades from The Daily Candle newsletter!
Hi, the link to join the whale room isn't working