

📈📉 Alt-season signs identified! BTC back to $25k first?
📈📉 Alt-season signs identified! BTC back to $25k first?

Bitget winner - 7031453132
Chart #1 - dYdX (DYDXUSDT) 1-Day Chart
Chartist: Sheldon

(For the chart screenshot, click here.)
DYDX has rallied to just over $3.00.
It is currently trading in a major area of resistance with the price overbought on higher time frames. Its next support is at $2.85, with major support below that at $2.50 - $2.70.
A break of $3.05 should take it to $3.30 - $3.50.
𝗣𝗿𝗶𝗺𝗲 𝗫𝗕𝗧
Sign up for a new Trading Account on Prime XBT!
Receive a deposit bonus of up to $7,000 with promo code: SheldonSniper
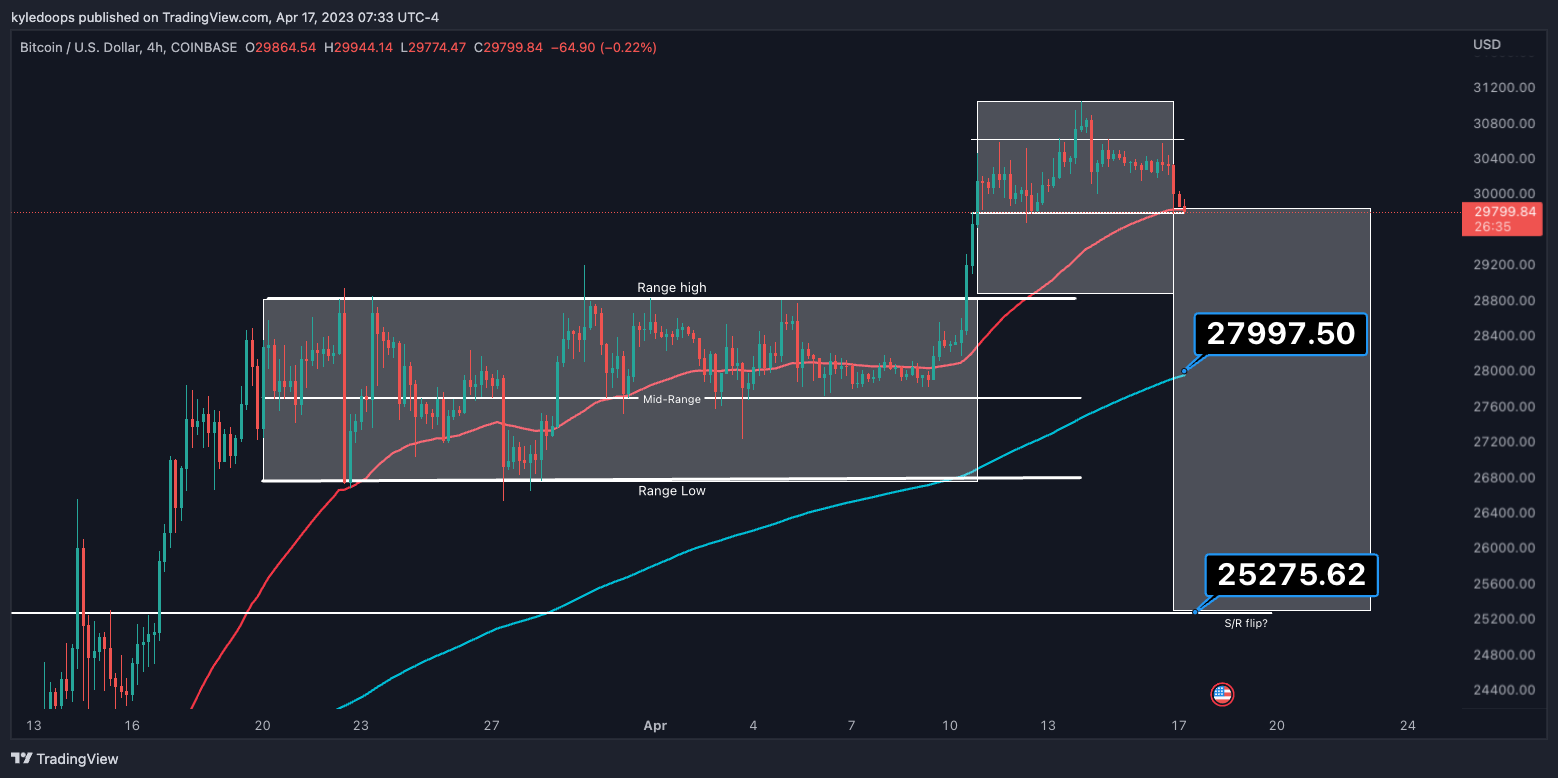
Chart #2 - Bitcoin (BTCUSD) 4-Hour Chart
Chartist: Kyle
(For the chart screenshot, click here.)
Bitcoin may be playing out a Power Of Three pattern! The pattern works as follows:
First, there is a period of consolidation.
Then there is manipulation to the upside.
Lastly, the price distributes to the downside.
My first area of interest is $27,997. If the 200 ema is lost, the next level to watch is $25,275 - which was the prior range high. We want to watch to see if that area flips from prior resistance into support.
𝗣𝗿𝗶𝗺𝗲 𝗫𝗕𝗧
Sign up for a new Trading Account on Prime XBT!
Receive a deposit bonus of up to $7,000 with promo code: KyleDoops

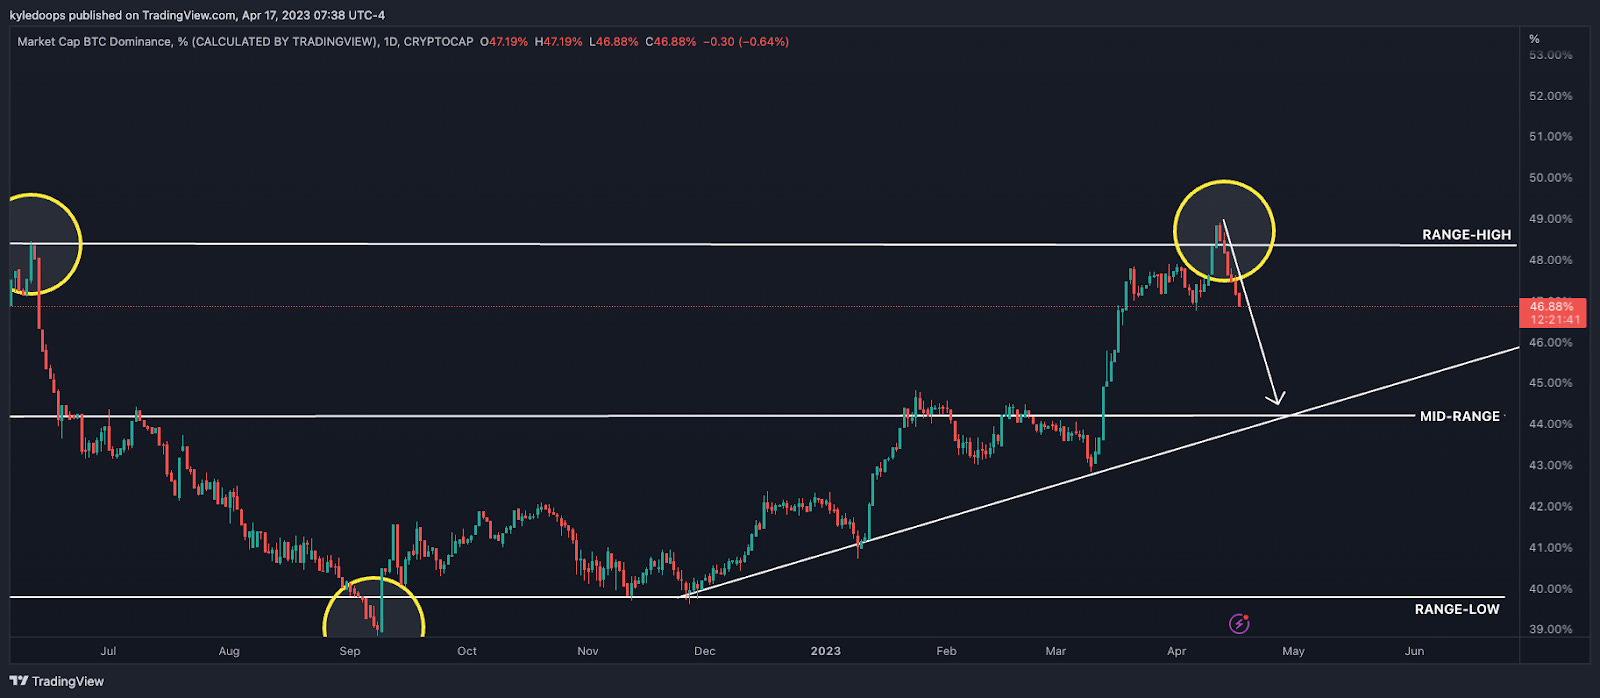
Chart #3 - Bitcoin Dominance (BTC.D) 1-Day Chart
Chartist: Kyle
(For the chart screenshot, click here.)
As bitcoin sells off, Bitcoin Dominance continues to fall, indicating money is flowing into altcoins.
I would play this scenario down to the diagonal trend line - around the mid-range - before considering rotating back into bitcoin.
Claim your Bitget sign-up bonuses here (details below).
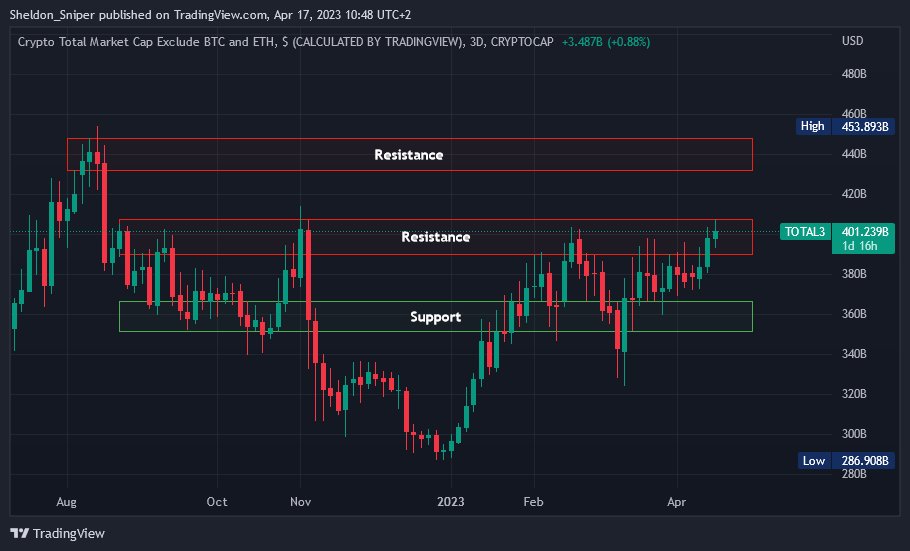
Chart #4 - TOTAL3 3-Day Chart
Chartist: Sheldon
(For the chart screenshot, click here.)
Over the last three weeks, the TOTAL3 has come from support at $370B, up to $400B.
Currently ranging between $390B - $405B (resistance zone), this is an area that has been tested on at least five occasions in the last seven months without cracking. If the TOTAL3 gets rejected here, the next support is at $380B, with major support below that at $350B - $370B.
But a break of the $405B resistance should take the TOTAL3 up to the next resistance at $430B - $450B. Combine that with Kyle’s analysis above and we can get a nice altseason on our hands. As long as BTC plays nicely that is.
Claim your Bitget sign-up bonuses here (details below).
Chart #5 - Bitcoin Fear and Greed Index
The Bitcoin Fear and Greed Index is sitting at 69 today, indicating Greed.
The highest the index has been over the past seven days is 69, and the lowest is 61.

Banter’s Take
Bitcoin is selling off but altcoins are holding up, and even increasing in value against USD and their BTC pairing. This supports the notion that a potential altseason is underway.
Our play on altcoins is cautiously bullish.
Stay safe my friends!
Go to our Crypto Banter Discord here where Sheldon and Kyle give updates on the charts and trades from The Daily Candle newsletter!
Bybit winner - 7995278