Hey Chart Hackers,
Today we’re breaking down seven high‑conviction setups across crypto and macro markets—covering everything from high‑probability pullbacks to breakout retests and structural shifts. Whether you’re hunting support zones, riding momentum, or managing risk in volatile conditions, we’ve got you covered!
Let’s dive in!
Overview
Chart #1 - Uniswap (UNIUSDT) 1-Day
Chart #2 - Bitcoin Cash (BCHUSDT) 8-Hour
Chart #3 - Zeus Network (ZEUSUSDT) 1-Hour
Chart #4 - Artificial Superintelligence Alliance (FETUSDT) 3-Day
Chart #5 - Bitcoin (BTC) 1-Day & Dominance
Chart #6 - Ethereum (ETHUSDT) 3-Day
Chart #7 - Cardano (ADAUSDT) 3-Day
Chart #8 - Tesla, Inc. (TSLA) 1-Day
Chart #1 - Uniswap (UNIUSDT) 1-Day
Chartist: Dylan’s Chart Hackers Team
(For the chart screenshot, click here.)
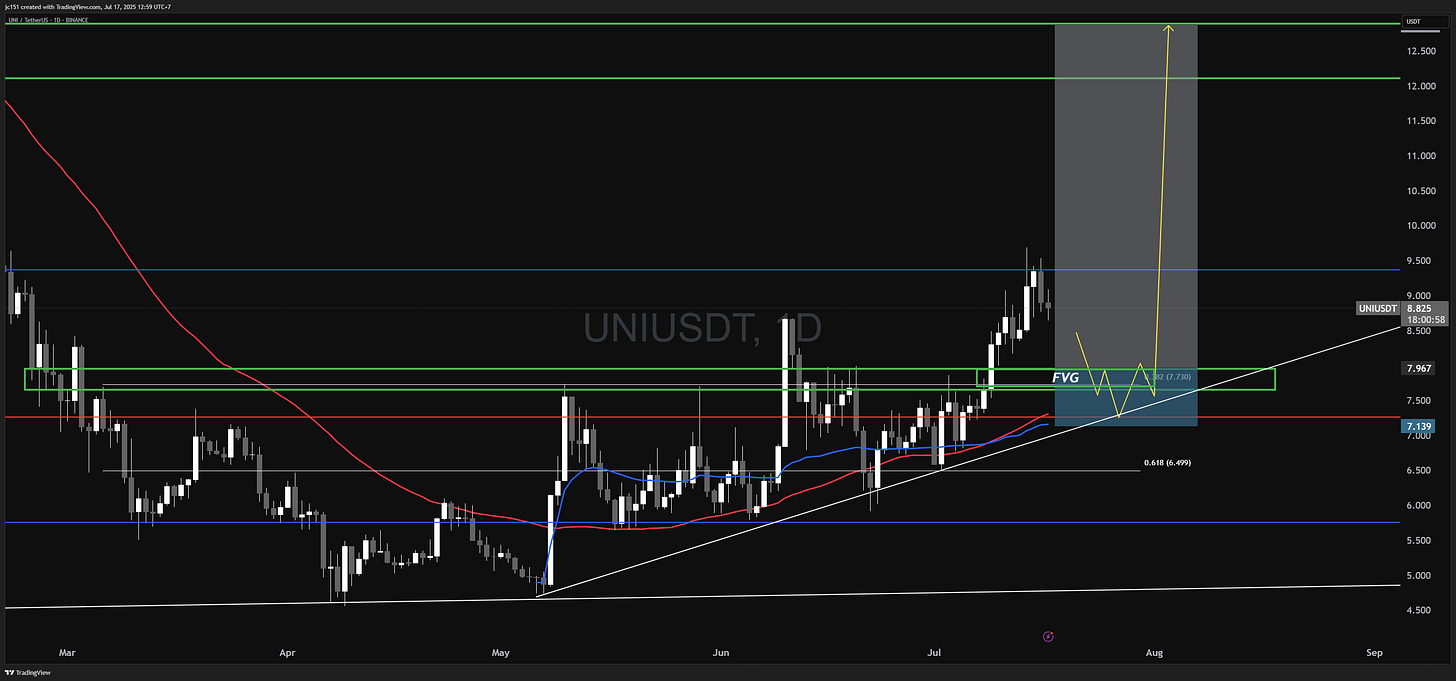
UNI is pulling back into a high-confluence zone after a strong breakout. Price is approaching both the ascending trendline from the local bottom and a previous cluster of consolidation — a key area where buyers previously stepped in. This zone also aligns with the Point of Control (POC) and an unfilled Fair Value Gap (FVG), making it a high-probability support zone.
Key Confluences:
50 SMA (daily) – dynamic support
VWAP from the low – anchored trend support
Previous cluster formation – proven structure
POC – high-volume node
Fair Value Gap (FVG) – unfilled inefficiency
0.382 retracement (~$7.73) – Fib support
Ascending trendline from local bottom
Trade Plan:
Entry: Ladder from $7.73 - $7.13
Take Profit (TP): $12.85 – prior resistance and clean inefficiency fill
Stop Loss: Below $6.50 (0.618 Fib and below trendline)
Leverage: 3x max (macro swing)
Execution: 25/25/25/25 DCA strategy
Limited Time Offer: Get 2 Weeks Free Access!
Get more exclusive trades from Dylan and his team by joining Chart Hackers with a 2-week free trial today! 👇
Join now to:
Access exclusive automated trading bots and indicators.
Join a private trading community on Discord & Telegram.
Learn expert entry and exit strategies from top traders.
Get real-time insights and high-level trade ideas.
Suitable for both beginners and advanced traders.
Chart #2 - Bitcoin Cash (BCHUSDT) 8-Hour
Chartist: Dylan’s Chart Hackers Team
(For the chart screenshot, click here.)
This is a lower‑leverage long/spot entry idea for BCH, based on the 0.382 pullback and key confluence entry points.
The entry is determined by a combination of metrics in a key level area of support, comprised of the quantum reactor, the 50-day MA, and a very bullish order block region. This red box also highlights a 0.382 pullback Fib retracement from the 7th April low. The Stop Loss is set on a rejection and breakdown of these levels, confirmed by a candle close below recent wicks. Take‑profit targets are based on a combination of order blocks on the much longer term and stronger daily timeframe. Confluence comes from the RSI bottoming and turning up, alongside other reversal signals. If the market remains bullish, this should offer a solid swing trade.
Entry: $476 region
Take Profit (TP):
TP1: $542 region (13% move)
TP2: $614 region (28% move)
Stop Loss: $450 region (candle close below) - 4%
This is approximately a 6:1 trade if TP2 is hit.
Get more exclusive trades from Dylan and his team by joining Chart Hackers with a 2-week free trial today! 👇
Chart #3 - Zeus Network (ZEUSUSDT) 1-Hour
Chartist: Dylan’s Chart Hackers Team
(For the chart screenshot, click here.)
ZEUS has been holding the anchored VWAP from the low and is now retesting that level. It has also entered a rising trend and is retesting the 50‑day moving average. We’re currently attempting to break the macro point‑of‑control zone—once it’s cleared, ZEUS should head toward the 100‑day MA and the value‑area high.
Entry: $0.1735 - $0.1875
Take Profit (TP):
TP1: $0.20
TP2: $0.24
TP3: $0.28
Stop Loss: 4-Hour close above: $0.1624
Get more exclusive trades from Dylan and his team by joining Chart Hackers with a 2-week free trial today! 👇
Chart #4 - Artificial Superintelligence Alliance (FETUSDT) 3-Day
Chartist: Dylan’s Chart Hackers Team
(For the chart screenshot, click here.)
With most altcoins hitting their yearly levels, FET has broken out of a 33‑day tight consolidation range. Assuming the market remains bullish and fresh liquidity flows in, FET looks primed for a potential 40% move to its yearly mid‑level. Given market volatility, leverage trades should use lower leverage and wider stops.
Long Trade Idea 1:
Any pullback into the 0.382 Fib retracement and the top of the cluster breakout is ideal for entries.
Entry: Ladder in $0.715 to $0.664
Take Profit (TP):
TP1: $0.79
TP2: $0.85
TP3: $0.99
Stop Loss: 4-Hour Close under $0.664
Leverage: no more than 5x
Long Trade Idea 2:
Conservative breakout retest approach to wait for a solid break into $0.8 and retest pullback to $0.74 region.
Entry: $0.771 through $0.724
Take Profit (TP):
TP1: $0.85
TP2: $0.91
TP3: $0.99
Stop Loss: 4-Hour close under $0.724
Leverage: no more than 5x
Get more exclusive trades from Dylan and his team by joining Chart Hackers with a 2-week free trial today! 👇
Chart #5 - Bitcoin (BTC) 1-Day & Dominance
Chartist: Dylan
Bitcoin (BTCUSD) 1-Day
(For the chart screenshot, click here.)
The daily chart looks strong for BTC, with fresh major support holding on serious dips around the $110,000 – $112,000 region. The rejection wick and subsequent consolidation have been exactly what the alts needed to get going. As long as BTC remains in this zone, the market should favor alts until the next major drop.
BTC Dominance (BTC.D) 1-Day
(For the chart screenshot, click here.)
BTC.D dropping like a stone has helped the alts pump this week. We’re now moving into the next two major alt danger zones with signs of a bounce brewing. If you have been printing profits this week, these zones are generally good areas to take some profits, as a bounce in BTC.D can often bring the alts down quite hard.
Get more exclusive trades from Dylan and his team by joining Chart Hackers with a 2-week free trial today! 👇
Chart #6 - Ethereum (ETHUSDT) 3-Day
Chartist: Dylan
(For the chart screenshot, click here.)
ETH has been extensively covered on my show and in Chart Hackers—and has been a great trade so far. But now it’s pushing into a major rejection zone at $3,500, so I’ve closed my existing ETH position at this resistance and will await the next entry. If the move continues, the upside target is $3,999, with key support on the daily timeframe at $3,000.
Get more exclusive trades from Dylan and his team by joining Chart Hackers with a 2-week free trial today! 👇
Chart #7 - Cardano (ADAUSDT) 3-Day
Chartist: Dylan
(For the chart screenshot, click here.)
ADA has been a laggard in breaking the 200‑day MA, but it finally joined the party yesterday—note the previous two occasions when ADA broke the 200‑day MA with force. This opens up the possibility of a horizontal breakout trade into the $1.16 region for a potential 40% move to the upside. Chart Hackers members got the higher‑leverage breakout play yesterday, but this could now be a great spot or very low‑leverage long opportunity, given the clear 200‑day MA break. I could use this level as the first major support zone and buy on weakness into the region. If the market remains bullish, we should see this zone hold, barring a wick or two lower.
Entry: $0.815 - $0.75
Take Profit (TP): $1.15
Stop Loss: Close below $0.70
Get more exclusive trades from Dylan and his team by joining Chart Hackers with a 2-week free trial today! 👇
Chart #8 - Tesla, Inc. (TSLA) 1-Day
Chartist: Dylan
(For the chart screenshot, click here.)
Recent FUD around TSLA hasn’t helped price action, but it’s held surprisingly well. Yesterday, Cathie Wood’s ARK Invest stepped in with a sizable purchase for their fund, clearly taking a long-term view. I see two options: I’ve already taken a long off the 200-day MA region targeting a 10–20% move, or I’m waiting for a higher-conviction zone around $272, where I have limit buy orders.
Entry: $320 - $310
Take Profit (TP):
TP1: $340
TP2: $355
TP3: $380
Stop Loss: Close below $309 (risk 4%)
Get more exclusive trades from Dylan and his team by joining Chart Hackers with a 2-week free trial today! 👇


