

📈📉 Altcoin resistance broken! But will the DXY kill the potential rally?
📈📉 Altcoin resistance broken! But will the DXY kill the potential rally?

Bitget winner - 3970877852
Wondering what that 👆 is and how you can win? Then check out our daily shows on YouTube!
Are you using Bybit instead? Then look for the winning Bybit account below. But if you want to double your chances of winning, sign up today to both exchanges with the links found in the description of our YouTube videos!
Good luck to all!
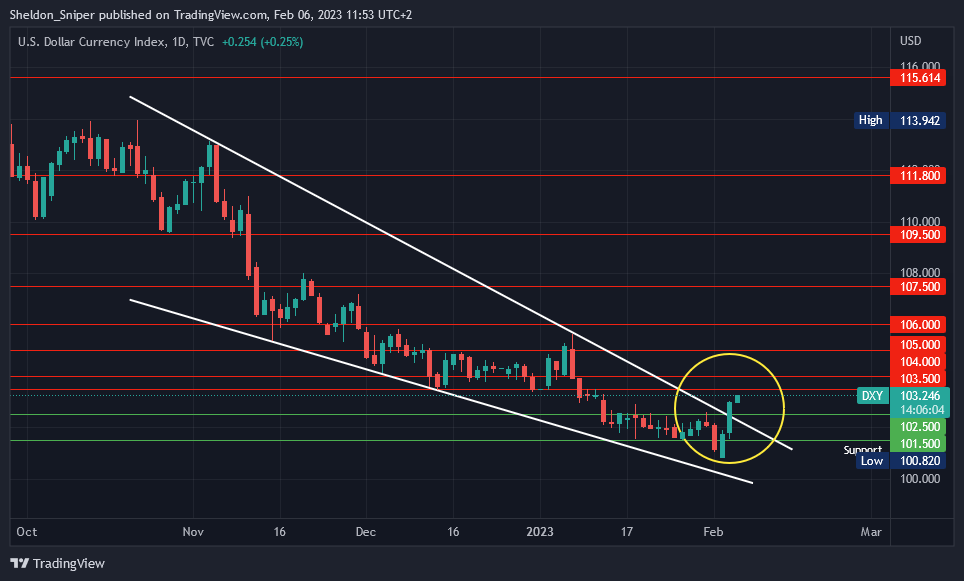
Chart #1 - DXY 1-Day Chart
Chartist: Sheldon
(For the chart screenshot, click here.)
The DXY has been in a downtrend since mid-September, resulting in a rally for stocks and (to some extent) crypto.
The DXY went from around 115 down to 101 from where it bounced back to 103 and also broke its falling wedge structure that had been holding since November. If the DXY continues upward in the upcoming weeks, it will be bad for the markets, as cash would flow out of them and into the Dollar.
The next resistance on the DXY is at 103.5 - 104, where I expect it to get rejected, bringing a small pullback to retest the lower area of support at 101.5 - 102.50.
Check our Crypto Banter Discord here for updates!
Follow me on Twitter for urgent updates on my trading progress!
Claim your Bitget sign-up bonuses here (details below).
Chart #2 - dYdX (DYDXUSDT) 8-Hour Chart
Chartist: Kyle

(For the chart screenshot, click here.)
DYDX came back into its range high and is now bouncing.
If DYDX holds the range high, I expect it to experience further upwards action. However, being a crucial level, if it turns around here and loses the range high, a move back down to the range low is quite possible.
Personally, I am leaning toward DYDX seeing another bounce.
Check our Crypto Banter Discord here for updates!
Make sure to follow me on Twitter, where I will post updates on my trades as they unfold!
Claim your Bitget sign-up bonuses here (details below).
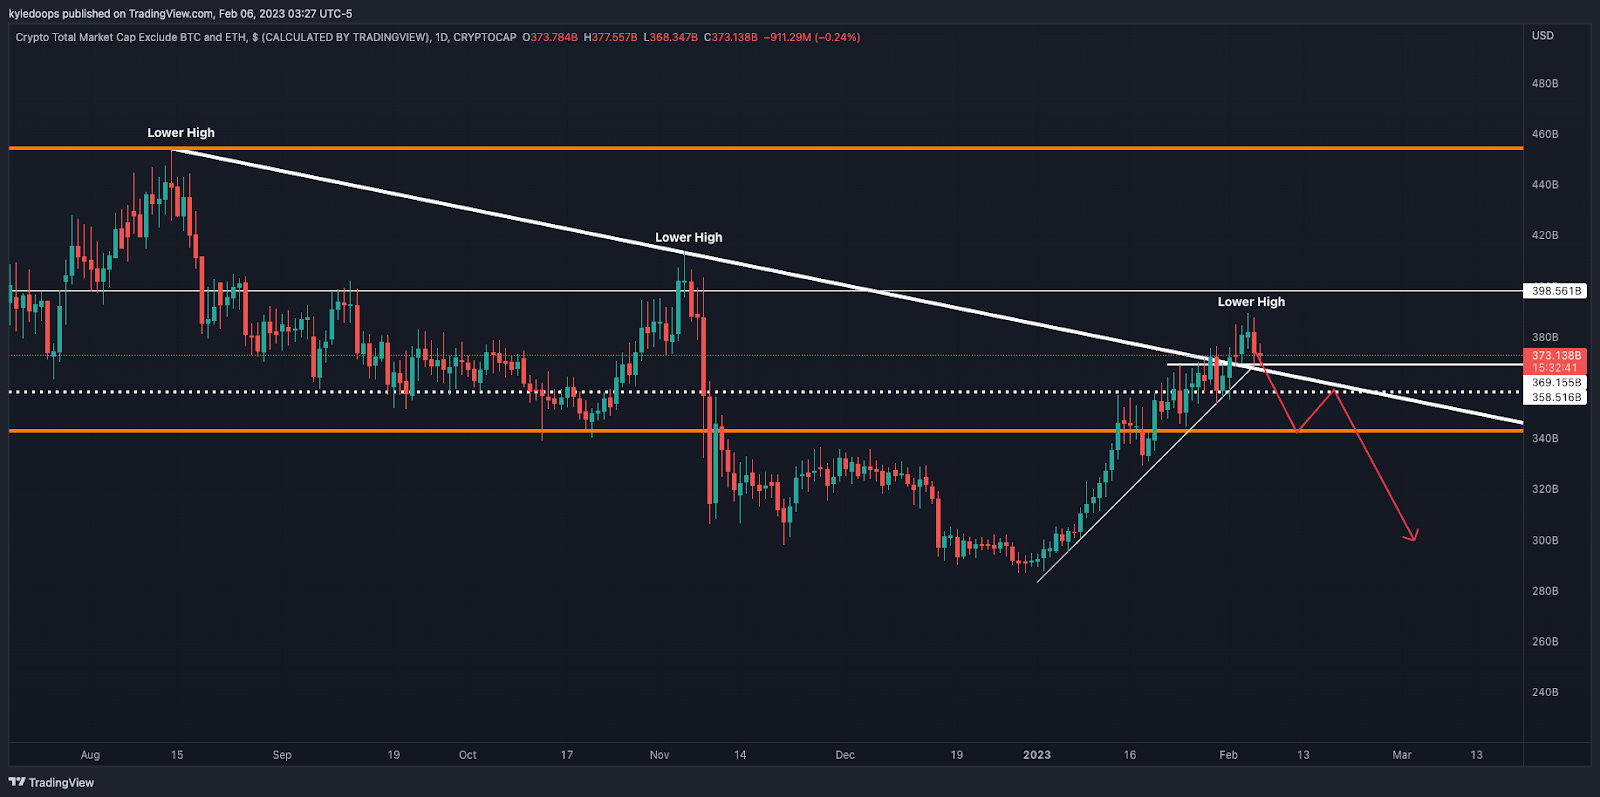
Chart #3 - TOTAL3 1-Day Chart
Chartist: Kyle
(For the chart screenshot, click here.)
The TOTAL3 has broken through its long-standing downward diagonal trend line, but it is yet to make a higher high above it.
As far as the wider trend goes, up to now it has experienced lower highs throughout.
A break below the $358.5 Billion level would confirm the bearish scenario, and lower prices would be in play for most of the altcoin market.
Check our Crypto Banter Discord here for updates!
Make sure to follow me on Twitter, where I will post updates on my trades as they unfold!
Claim your Bitget sign-up bonuses here (details below).
Chart #4 - Bitcoin (BTCUSDT) 8-Hour Chart
Chartist: Sheldon

(For the chart screenshot, click here.)
Over the last few days, bitcoin retraced from $24,300 (resistance) to $22,830, putting it within the $22,600 - $23,000 area of support.
BTC needs to hold support here to prevent any further downside, as, if lost, the next area of support is at $21,300 - $21,800, followed by the 200 Moving Average on the daily, at $19,725.
If bitcoin moves up to the $24,300 area of resistance again and fails to break through, it could create a "double top" which would foretell a deeper retrace is coming in the next few weeks.
Check our Crypto Banter Discord here for updates!
Follow me on Twitter to get all the updates on my personal trading progress!
Claim your Bitget sign-up bonuses here (details below).
Chart #5 - Bitcoin Fear and Greed Index
The Bitcoin Fear and Greed Index is sitting at 56 today, indicating Greed.
The highest the index has been over the past seven days is 60, and the lowest is 51.

Overall Market Sentiment (Banter’s Take)
Bitcoin and the broader crypto market may finally be having a reasonable pullback.
The next most important thing is to focus on whether the pullback will form a higher low. If so, I expect BTC to quickly make its way toward the $30k level. But, if bitcoin revisits its range lows, it's unlikely crypto prices will hold, and a major bull trap will likely be confirmed.
Stay safe my friends!
Bybit winner - 28287520