

📈📉 Altcoins on the Edge: INJ Holds the Weekly Open, What Next?
📈📉 Altcoins on the Edge: INJ Holds the Weekly Open, What Next?

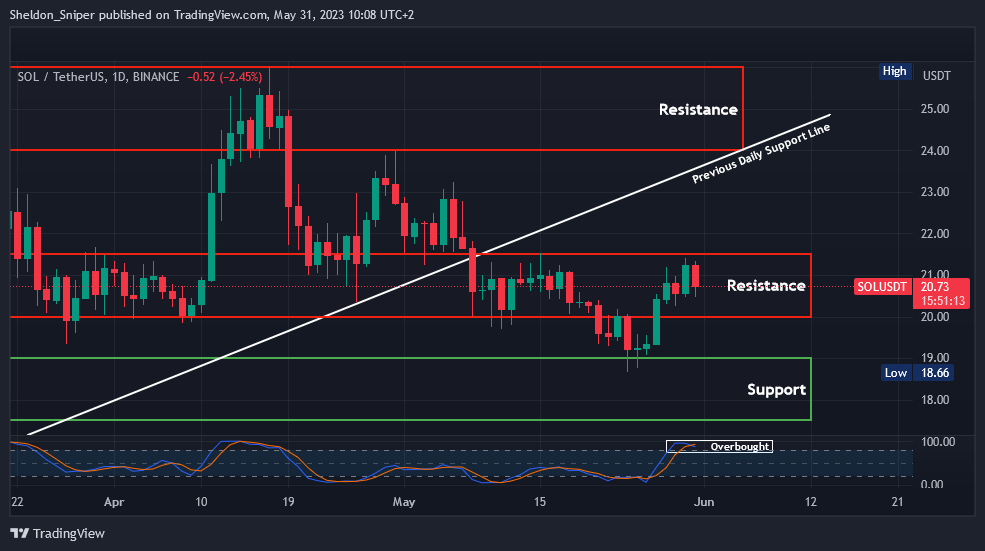
Chart #1 - Solana (SOLUSDT) 1-Day Chart
Chartist: Sheldon
(For the chart screenshot, click here.)
SOL has rallied from a low of approximately $18.60 to yesterday's high of around $21.40 over the past week. However, the price was rejected at that level and has started to trend lower along with the rest of the market.
The price is overbought on higher timeframes, and if the $20.00 - $21.50 level does not hold, SOL could drop to test the next support level within the $17.00 - $19.00 range.
However, if SOL can break through the $21.50 mark, the next resistance is between $24 - $26. Also worth noting is the previous daily support line, which has now transitioned into a resistance line that intersects in the same area.
𝗣𝗿𝗶𝗺𝗲 𝗫𝗕𝗧
Sign up for a new Trading Account on Prime XBT!
Receive a deposit bonus of up to $7,000 with promo code: SheldonSniper
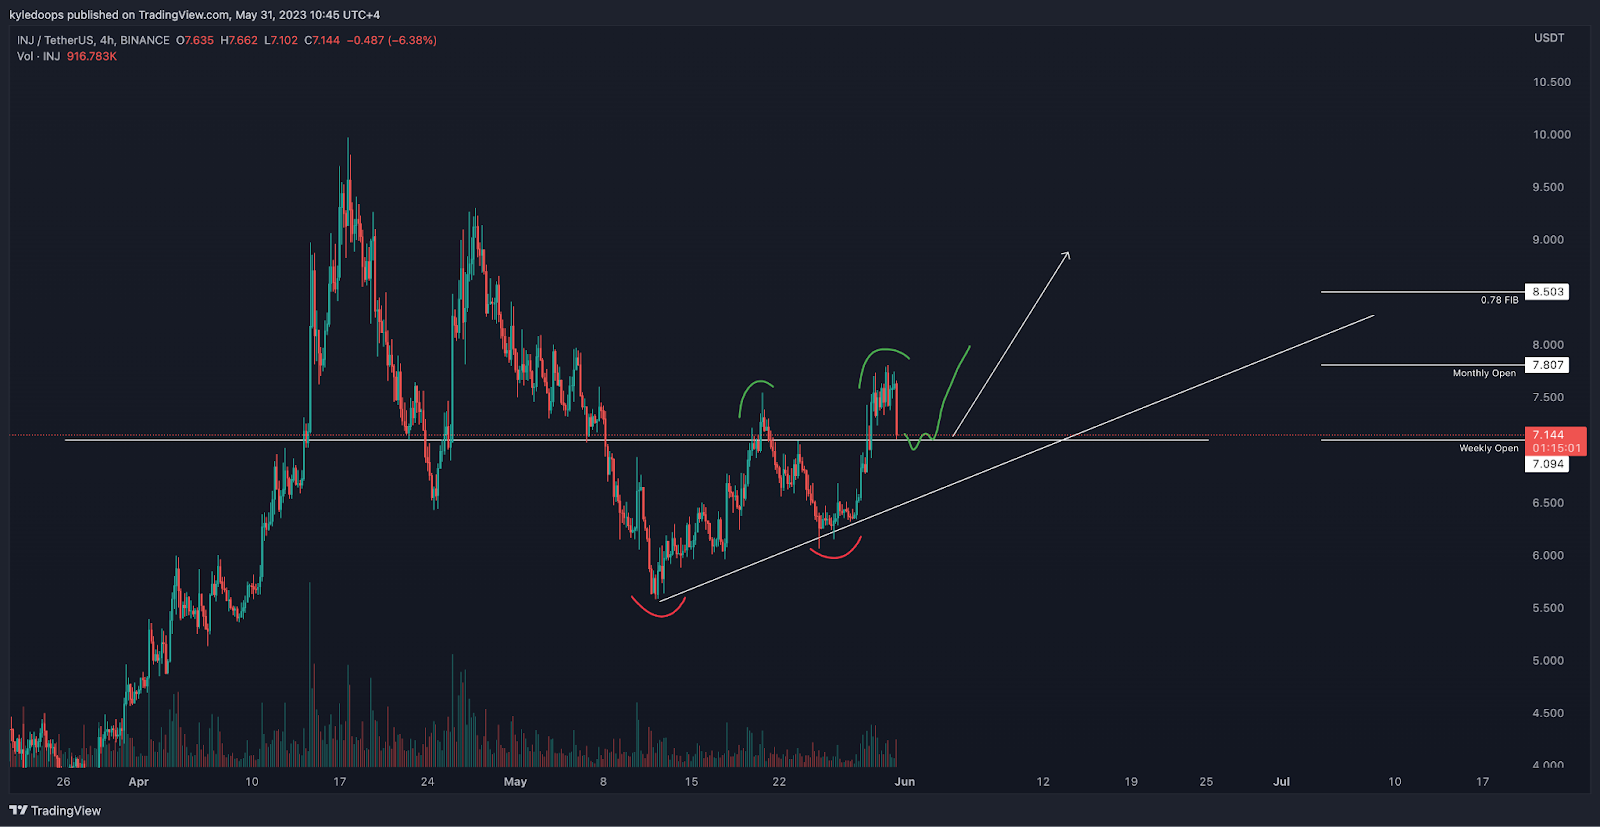
Chart #2 - Injective (INJUSDT) 4-Hour Chart
Chartist: Kyle
(For the chart screenshot, click here.)
With the recent pullback, many altcoins are nearing support levels.
Injective (INJ), for instance, is at the weekly open. Should it hold this level, I would anticipate a bounce from this zone. However, if the level is lost, watch for a third test of the ascending trend line that is seen in the chart.
𝗣𝗿𝗶𝗺𝗲 𝗫𝗕𝗧
Sign up for a new Trading Account on Prime XBT!
Receive a deposit bonus of up to $7,000 with promo code: KyleDoops
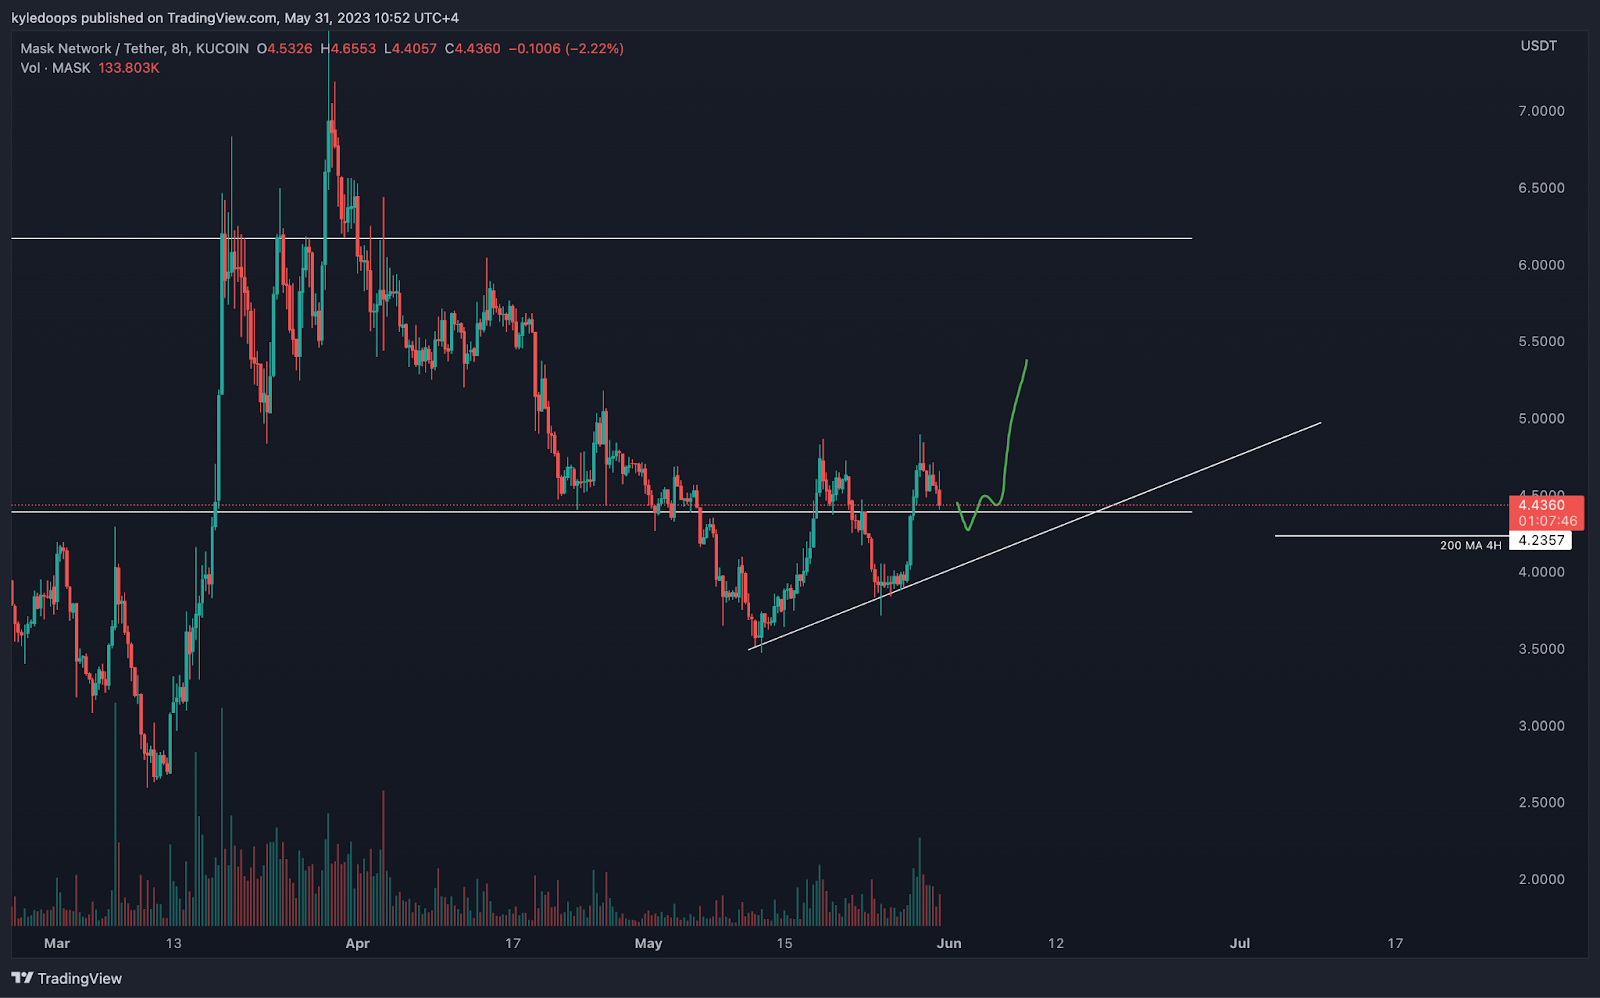
Chart #3 - Mask Network (MASKUSDT) 8-Hour Chart
Chartist: Kyle
(For the chart screenshot, click here.)
Watch for a potential deviation around the $4.40 level. If you observe an over-under, expect the price to bounce.
This, combined with the 200 MA on the 4-hour chart converging at the exact same level, could provide substantial support for at least a short-term bounce.
Claim your Bitget sign-up bonuses here (details below).
Chart #4 - Bitcoin (BTCUSDT) 1-Day Chart
Chartist: Sheldon

(For the chart screenshot, click here.)
Yesterday, the price of BTC was rejected at $28,000.
Over the last 24 hours, the price has dropped significantly to around $27,140, breaking the important $27,500 support level in the process. For now, the price has stabilized and found support. The key question is whether, if the price trends higher from here, it will be able to recapture the $27,500 level.
The STOCH RSI on higher timeframes is overbought. If the price is rejected at $27,500, we could see further downside, possibly testing the $26,650 mark, or the weekly 200 Moving Average just below that.
Claim your Bitget sign-up bonuses here (details below).
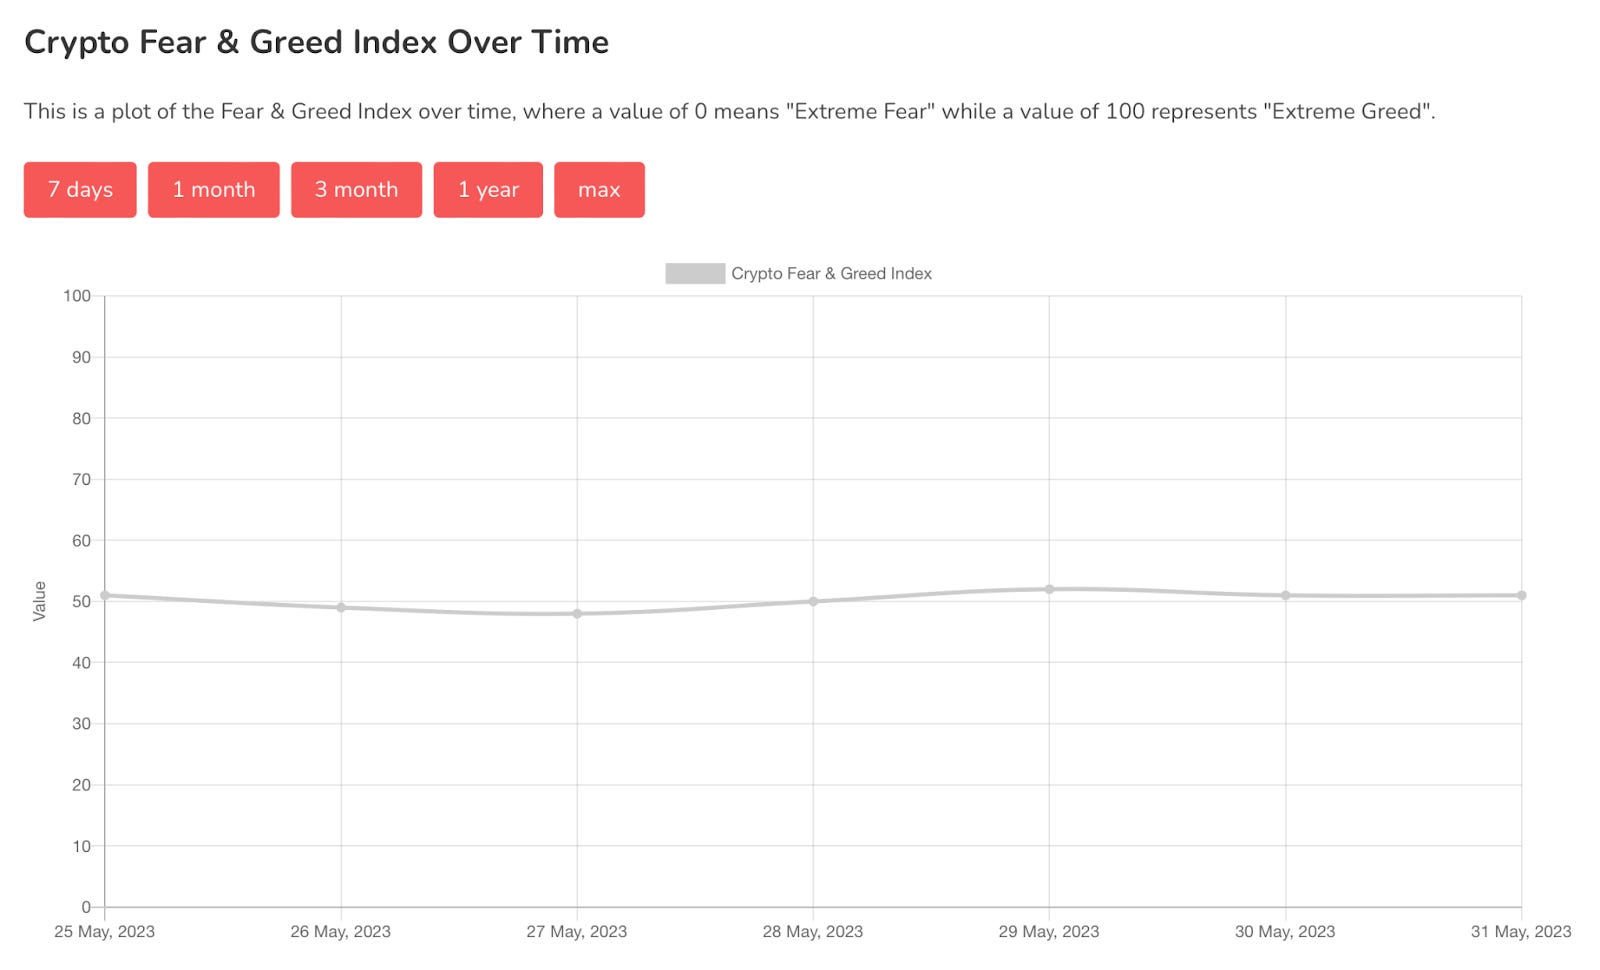
Chart #5 - Bitcoin Fear and Greed Index
The Bitcoin Fear and Greed Index is sitting at 51 today, Neutral.
The highest the index has been over the past seven days is 52, and the lowest is 48.
Banter’s Take
The recent sell-off was expected, as bitcoin needed to fill a CME gap.
Price however needs to bounce very soon, or bears will likely take back control and distribute it further. The advantage, in the medium term, is slightly favorable towards the bulls.
Stay safe my friends!
Go to our Crypto Banter Discord here where Sheldon and Kyle give updates on the charts and trades from The Daily Candle newsletter!