

📈📉 Alts Will SUFFER! Bitcoin Dominance Breaks Trend!
📈📉 Alts Will SUFFER! Bitcoin Dominance Breaks Trend!

Overview
Chart #1 - U.S. Dollar (DXY) 2-Day Chart
Chart #2 - Bitcoin (BTCUSD) Daily Chart
Chart #3 - Ethereum (ETHUSD) Daily Chart
Chart #4 - Bitcoin Dominance (BTC.D) Daily Chart
Chart #5 - Fear and Greed Index

Chart #1 - U.S. Dollar (DXY) 2-Day Chart
Chartist: Sheldon
(For the chart screenshot, click here.)
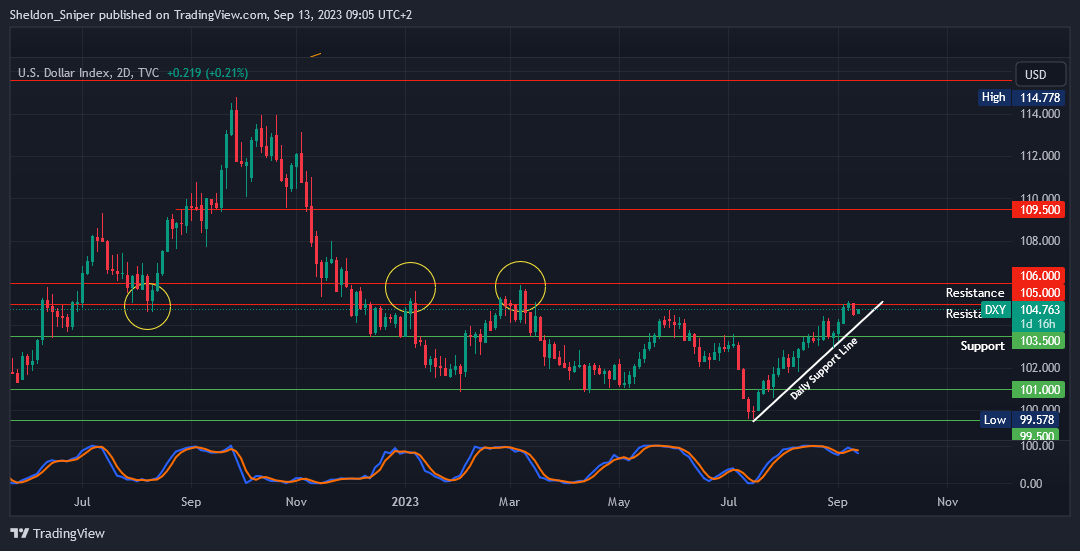
The DXY has reached resistance at 105.00 - 106.00, an area that has acted as major resistance multiple times in the past.
I am eagerly looking for a rejection in this area for the DXY to reverse its trend and move back to the downside. A move to the downside would be bullish for the markets, as cash leaves the US Dollar and flows into risk-on assets.
If the DXY drops from here, the next support is 104.00. If the DXY resumes its upward trend and breaks through the 106.00 level, the next major resistance is approximately at 109.50.
𝗣𝗿𝗶𝗺𝗲 𝗫𝗕𝗧
Sign up for a new Trading Account on Prime XBT!
Receive a deposit bonus of up to $7,000 with promo code: SheldonSniper
Sign-up and trade on Bybit today.
Exclusive $30,000 deposit rewards and bonuses up for grabs!
Chart #2 - Bitcoin (BTCUSD) Daily Chart
Chartist: Kyle
(For the chart screenshot, click here.)
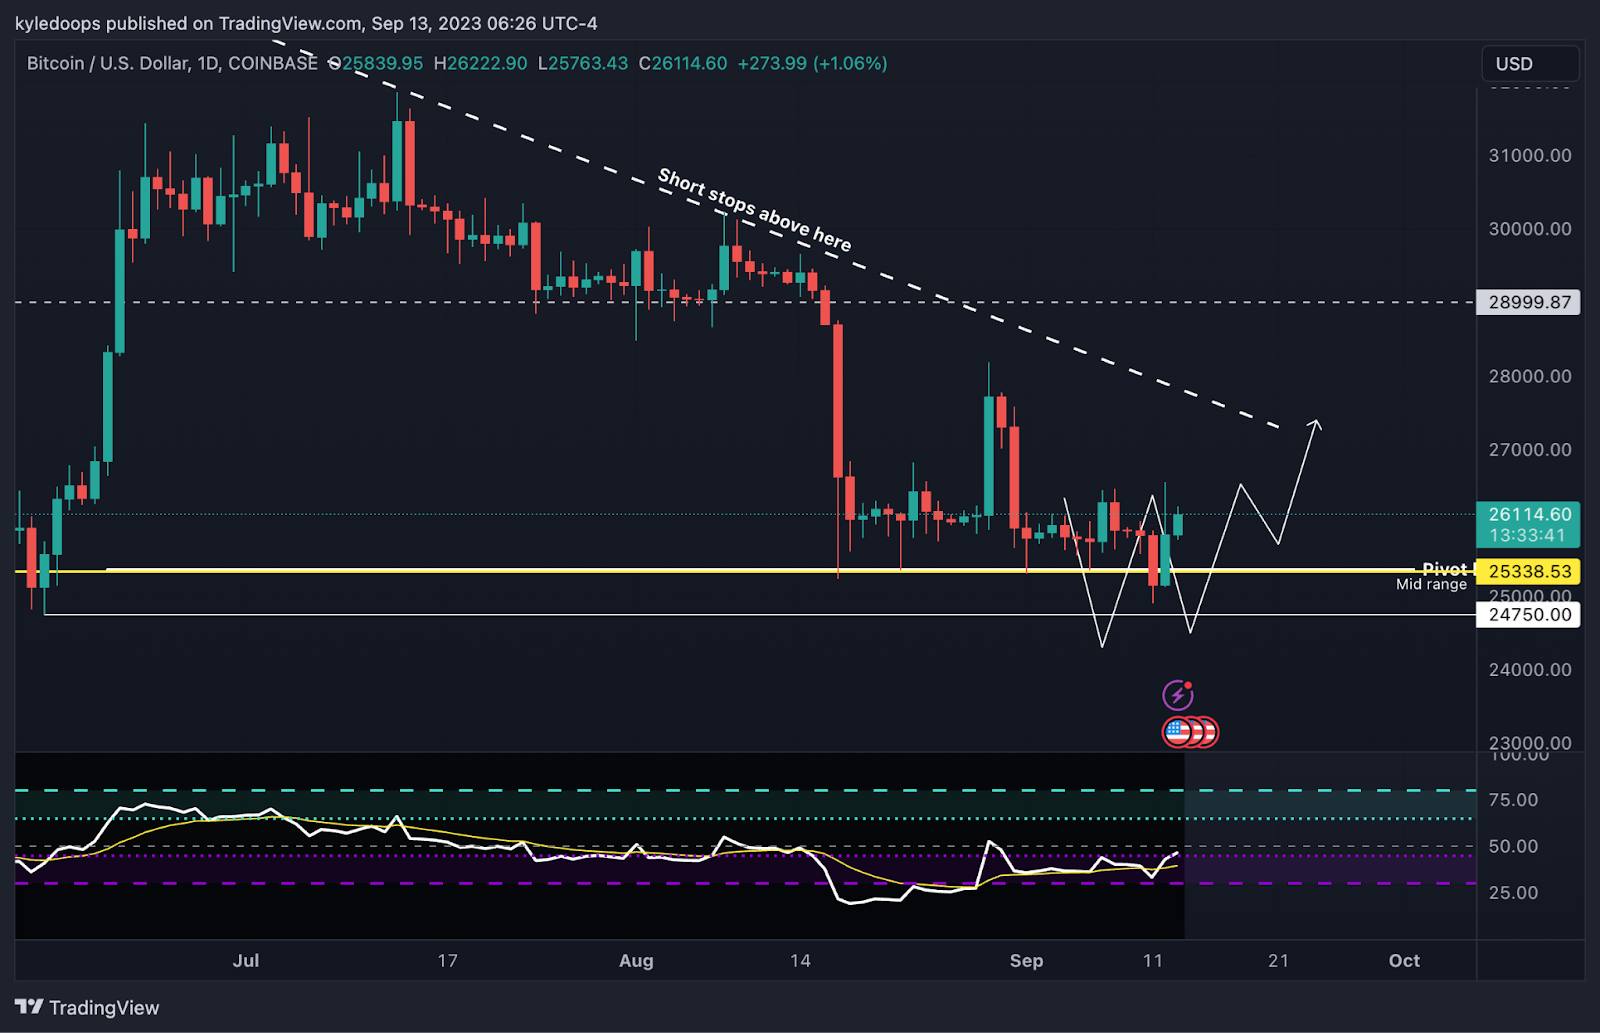
Bitcoin has made interesting moves by reclaiming the yellow horizontal line representing the mid-range.
This line coincides with the pivot level set at $25,338. As a result, the RSI is expected to trend upward, meaning that momentum is likely to continue rising.
The downtrending trend line is stacked with short liquidity, making it an attractive target. If momentum persists, prices might break through that level, potentially reaching up to $28,000.
𝗣𝗿𝗶𝗺𝗲 𝗫𝗕𝗧
Sign up for a new Trading Account on Prime XBT!
Receive a deposit bonus of up to $7,000 with promo code: KyleDoops
Chart #3 - Ethereum (ETHUSD) Daily Chart
Chartist: Kyle
(For the chart screenshot, click here.)
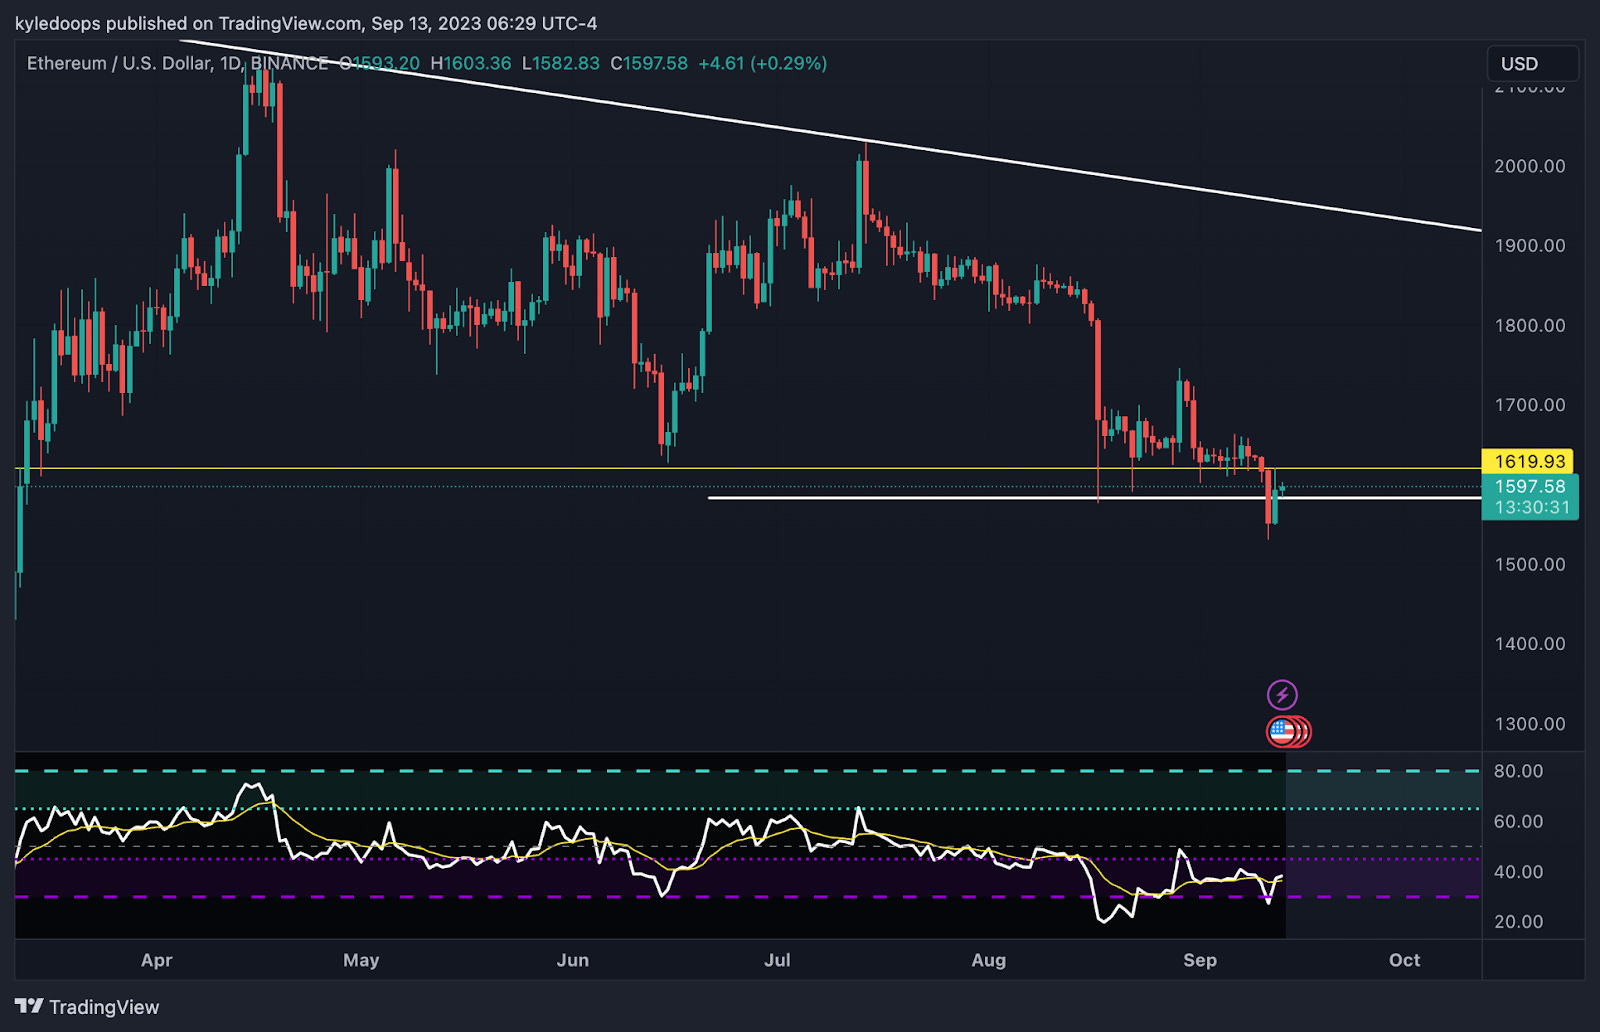
ETH has regained the pivot level but remains below the yellow line, representing the daily mid-range.
If bulls push the price above $1,730, there will be a structural break and a reclaim of the mid-range, indicating potential higher prices ahead.
Until that happens, there's still a downside risk for ETH.
Claim your Bitget sign-up bonuses here (details below).
Chart #4 - Bitcoin Dominance (BTC.D) Daily Chart
Chartist: Sheldon
(For the chart screenshot, click here.)
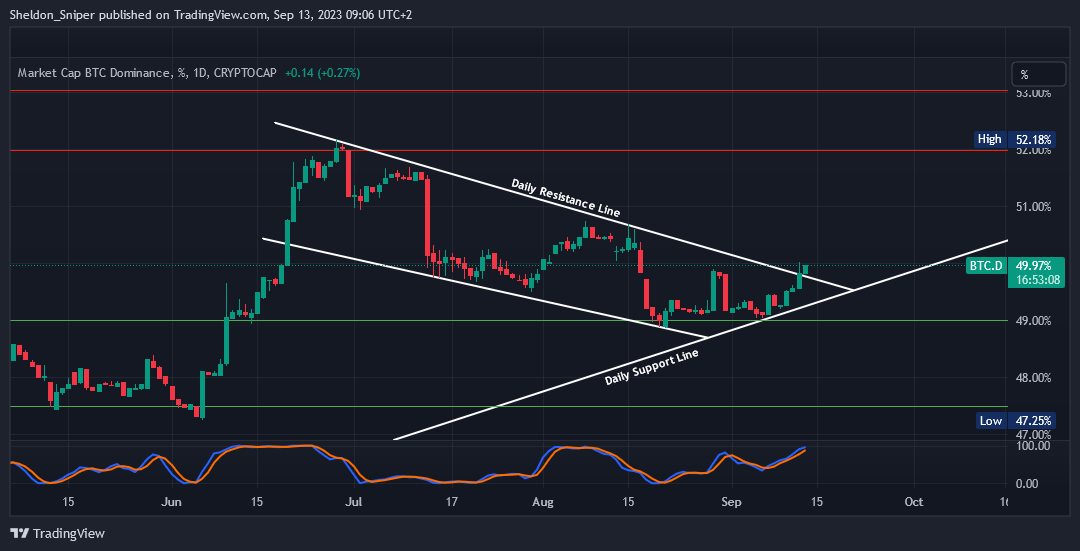
BTC.D has just broken through the two-and-a-half-month resistance line from the end of June. This, as liquidity is continually getting drained from the altcoin market.
With BTC.D currently around 50%, the next level of resistance stands at 51%.
Significant support exists directly below the current 50% mark, at 49.50%.
Claim your Bitget sign-up bonuses here (details below).
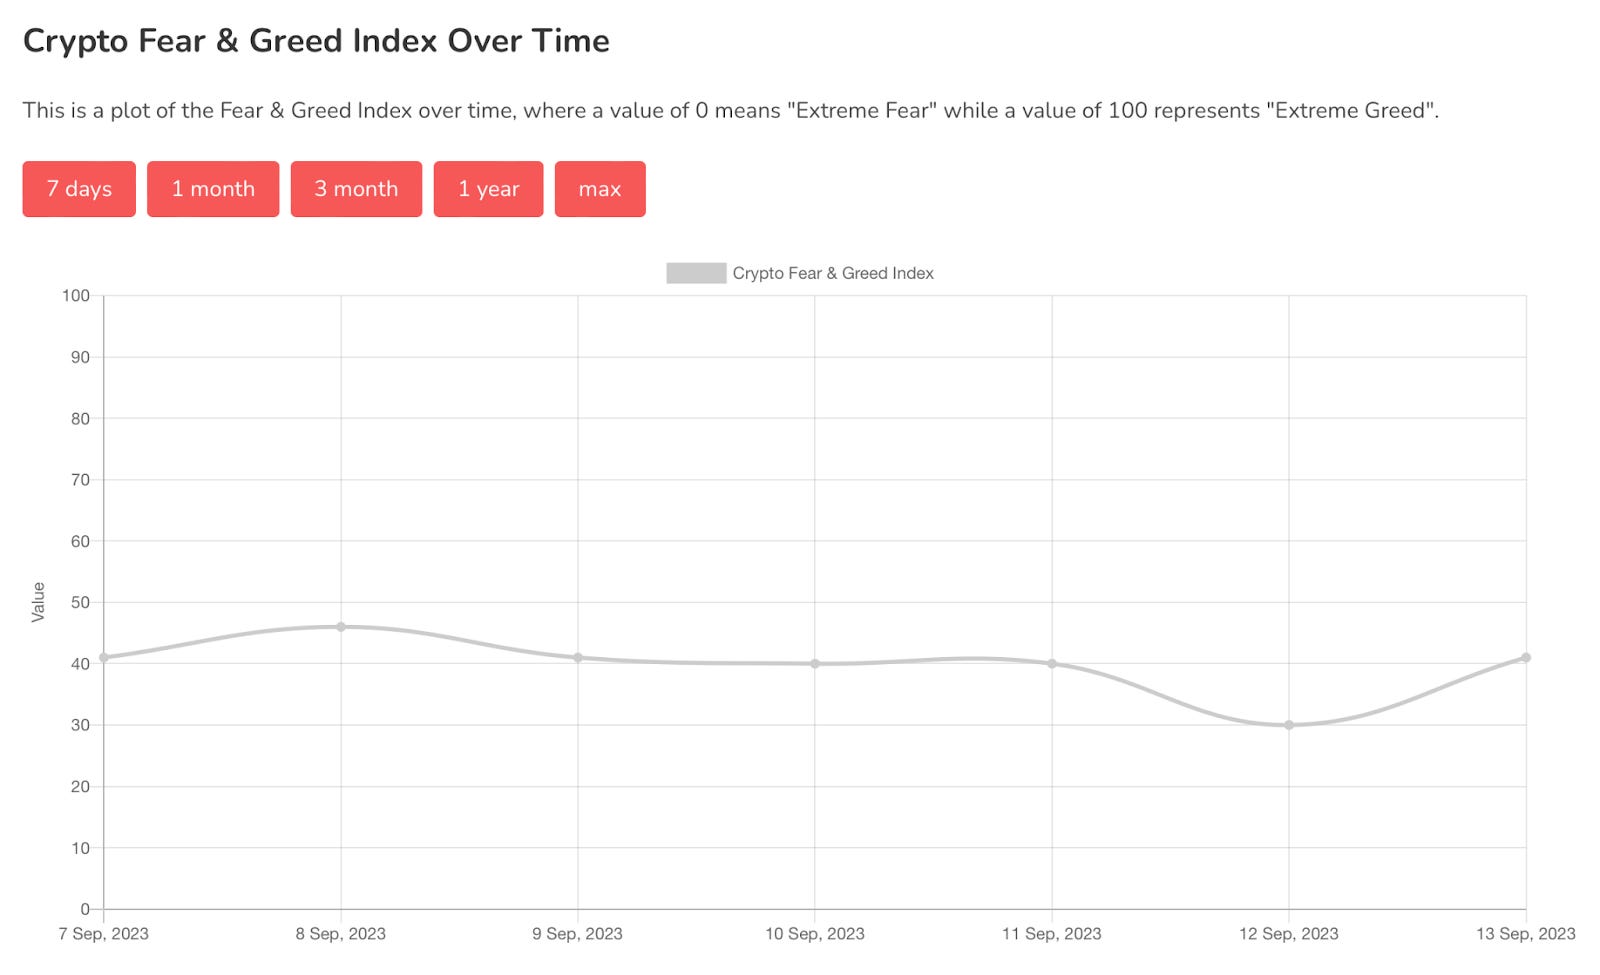
Chart #5 - Fear and Greed Index
The Fear and Greed Index is sitting at 41 today, indicating Fear.
The highest the index has been over the past seven days is 46, and the lowest is 30.
Banter’s Take
The market is eagerly anticipating today's CPI inflation results. If the results are better than expected, Bitcoin and other crypto will likely trend upwards. However, if the results are disappointing, prices may lose their pivot levels and continue to decline into Thursday.
Stay safe my friends!
Go to our Crypto Banter Discord here where Sheldon and Kyle give updates on the charts and trades from The Daily Candle newsletter!