

📈📉 Alts Will SUFFER If BTC Loses THIS Level!
📈📉 Alts Will SUFFER If BTC Loses THIS Level!
PLUS: STX Looking Bullish!
Overview
Chart #1 - Crypto Total Market Cap (TOTAL) Daily
Chart #2 - Celestia (TIAUSD) 4-Hour
Chart #3 - Stacks (STXUSDT) Daily
Chart #4 - Ethereum (ETHUSDT) Weekly
Chart #5 - Fear and Greed Index
Chart #1 - Crypto Total Market Cap (TOTAL) Daily
Chartist: Sheldon

(For the chart screenshot, click here.)
Over the last month, the TOTAL has been ranging between $1.52T and $1.70T, in anticipation for the ETF news. Though oversold, I don’t anticipate it breaking out of the current range until the news is out.
If the ETF is approved, the TOTAL could break higher than $1.7T. But, on the other hand, a rejection could send it down to $1.4T - $1.45T.
Sign-up and trade on Bybit today.
Exclusive $30,000 deposit rewards and bonuses up for grabs!
Chart #2 - Celestia (TIAUSD) 4-Hour
Chartist: Kyle
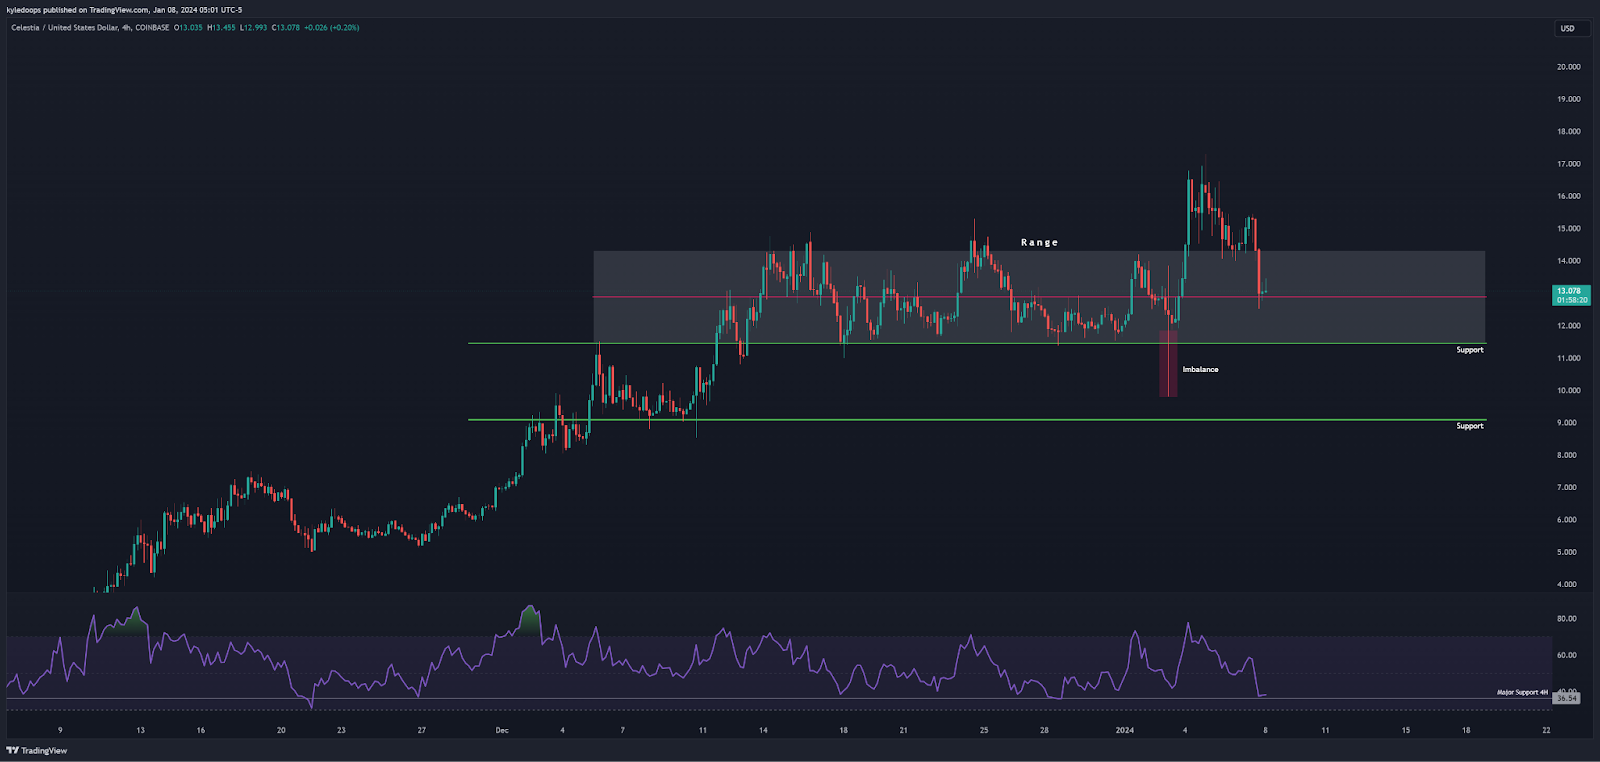
(For the chart screenshot, click here.)
We can see that TIA has returned back into the range with two key support levels at $11.45 and $9.00. There is a possibility that it could target both support areas, as there is an imbalance wick between $11.85 and $9.80.
We may see at least 50% of the gap filled, if not fully.
The 4H RSI has shown some early signs of reversal at a key level of support.
The next resistance lies at $16.50, a level where we have evidence of the price getting rejected previously.
Claim your Bitget sign-up bonuses here (details below).

Outsmart 99% Of The Market!
Get full access into our Discord And Telegram group, where you'll find all of our premium content!
👉 Trade Signals!
👉 Trade Set-Ups!
👉 Trading Challenges!
👉 Education!
👉 SO MUCH MORE!
Chart #3 - Stacks (STXUSDT) Daily
Chartist: Kyle
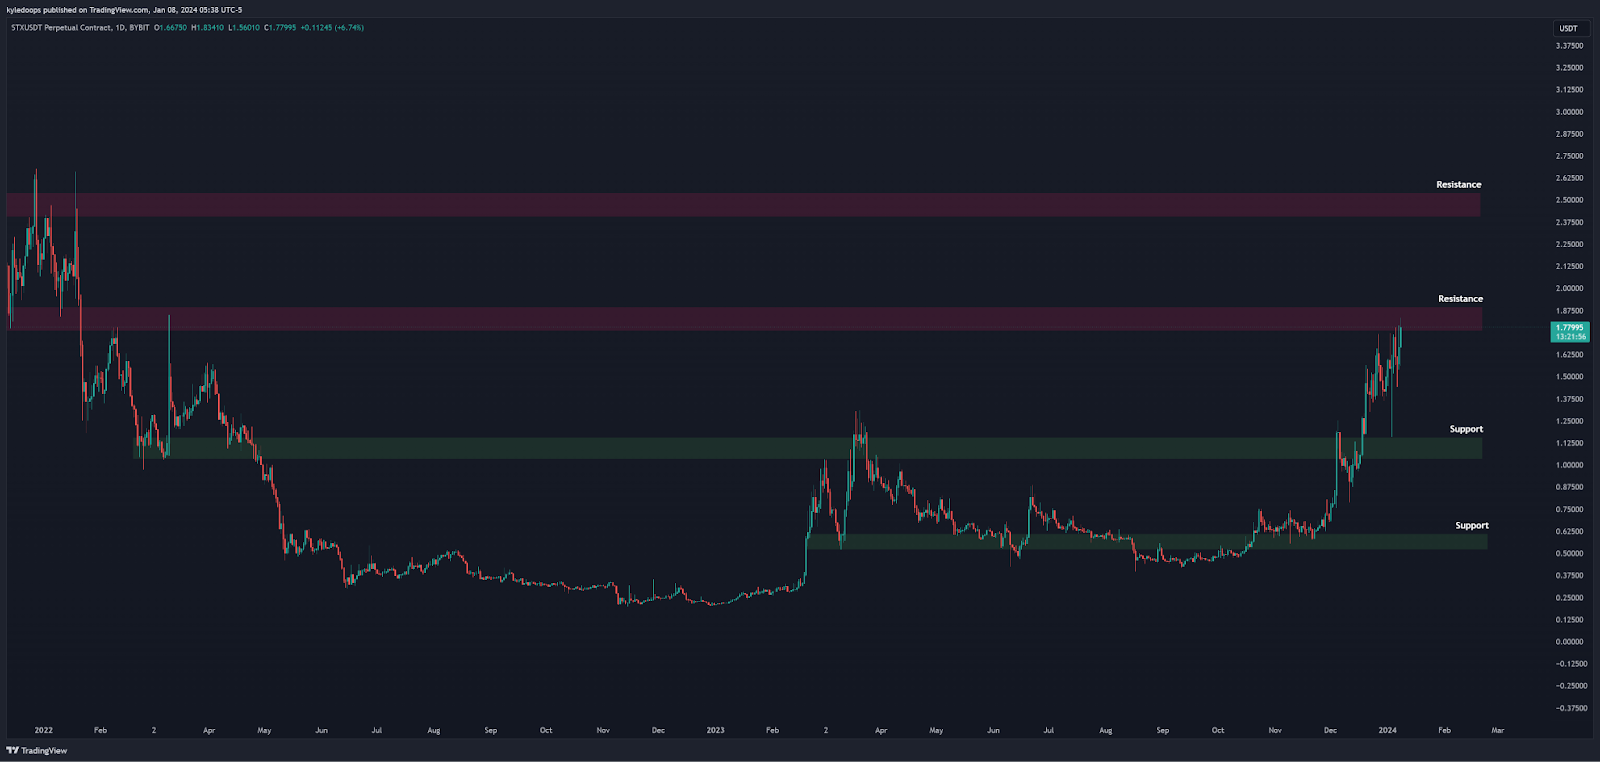
(For the chart screenshot, click here.)
Sitting at a market cap of $2.6B, STX has been on a constant rise since November, and we can observe that it hasn't shown any sign of weakness so far.
While other altcoins made corrections in the past weeks, STX keeps pushing and had a very quick recovery from last week's dip, which suggests that STX may perform very well in the coming days.
It is heading into a resistance area, so be mindful of others potentially taking profits, but you should not be caught by surprise.
For sure, so far the buyers are in control.
Claim your Bitget sign-up bonuses here (details below).
Chart #4 - Ethereum (ETHUSDT) Weekly
Chartist: Sheldon
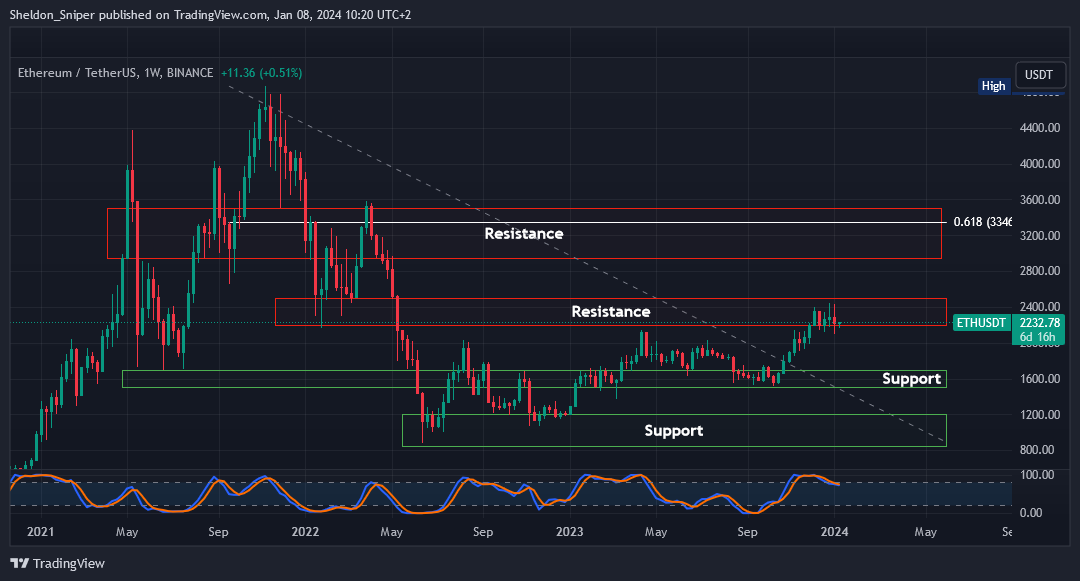
(For the chart screenshot, click here.)
ETH has been ranging between $2,200 and $2,500 over the past few weeks.
I would expect ETH to test $2,850 - $3,550 if we get a Bitcoin spot ETF approval that sends the market soaring.
The 0.618 Fibonacci level, calculated between the high at the end of 2021 and the low in the middle of 2022, lies within this resistance area and will be tough to break through.
If the $2,200 bottom of the range level of support is breached on higher timeframes, then the next major area of support is $1,550 - $1,650.
Claim your Bitget sign-up bonuses here (details below).
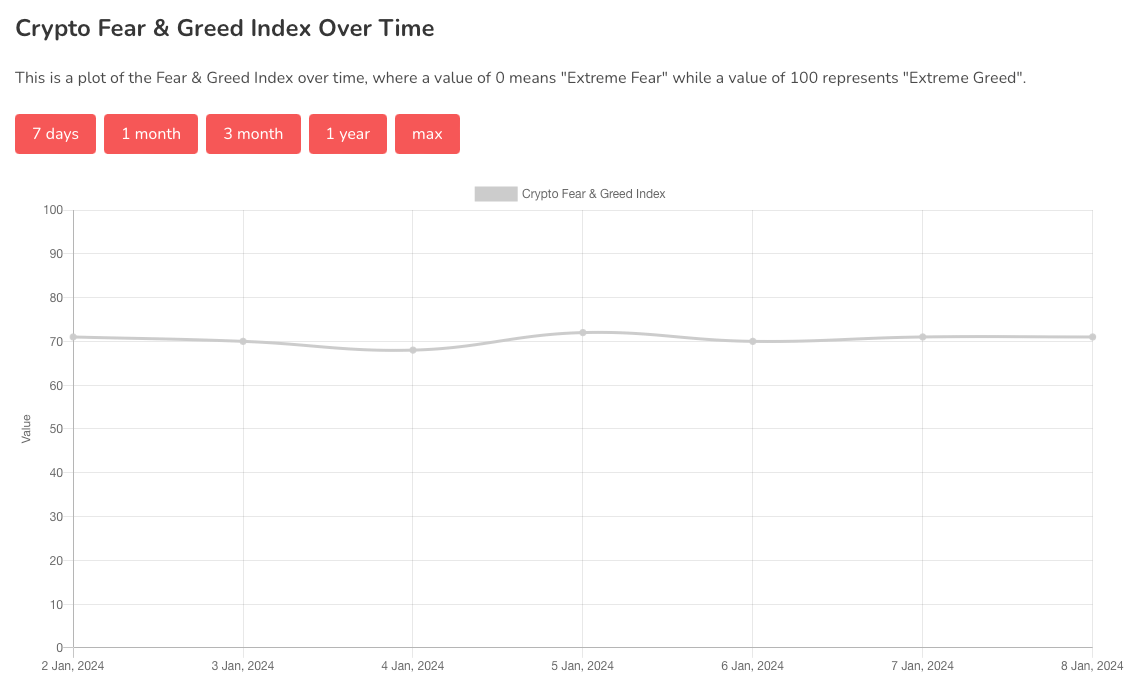
Chart #5 - Fear and Greed Index
The Fear and Greed Index is sitting at 71 today, indicating Greed.
The highest the index has been over the past seven days is 72, and the lowest is 68.
Banter’s Take
While Bitcoin is "busy" ranging between $40,000 and $44,000, the altcoins have already undergone corrections. We need to see Bitcoin breaking and holding above $44,700; if that happens, we can expect altcoins to bounce from here. On the other hand, if Bitcoin targets the bottom of the current range at $40,200, it may push altcoins to lower support levels, presenting traders with fresh opportunities.
Stay safe my friends!
Go to our Crypto Banter Discord here where Sheldon and Kyle give updates on the charts and trades from The Daily Candle newsletter!