

📈📉 Altseason incoming? Massive SOUL and DYDX trades identified!
📈📉 Altseason incoming? Massive SOUL and DYDX trades identified!

Bitget winner - 3255075768
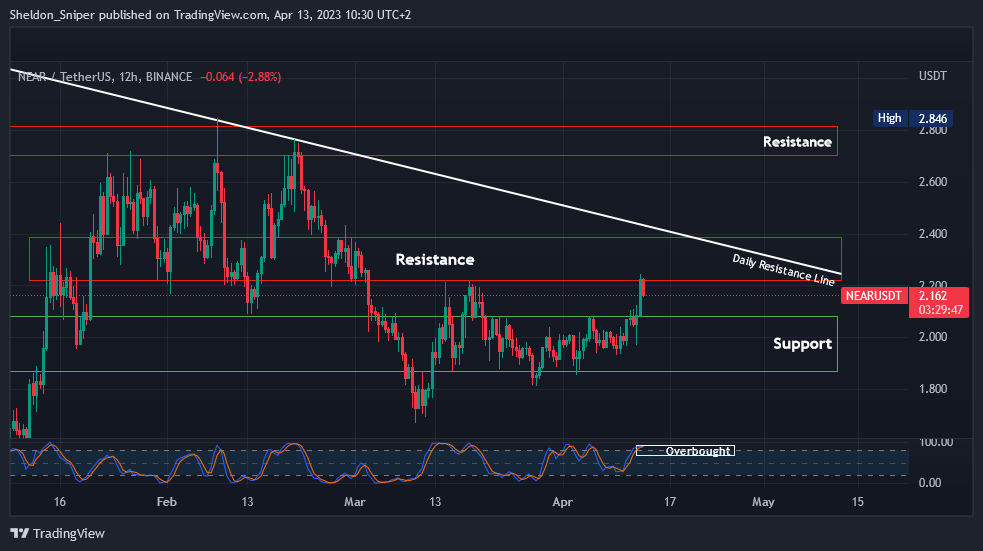
Chart #1 - NEAR Protocol (NEARUSDT) 12-Hour Chart
Chartist: Sheldon
(For the chart screenshot, click here.)
NEAR is showing some signs of life. Over the last week, it has rallied from $1.85 up to this morning’s high of $2.20.
It is once again testing the critical $2.20 - $2.40 resistance zone, and the Stoch RSI on higher time frames is flashing overbought. There is a lot of resistance in the above zone, with the daily descending resistance line also intersecting at around $2.40.
If NEAR can break through resistance, it may reach $2.70 - $2.80, whereas if the price gets rejected at around $2.20, then it should retest $2.00 - $2.10.
𝗣𝗿𝗶𝗺𝗲 𝗫𝗕𝗧
Sign up for a new Trading Account on Prime XBT!
Receive a deposit bonus of up to $7,000 with promo code: SheldonSniper
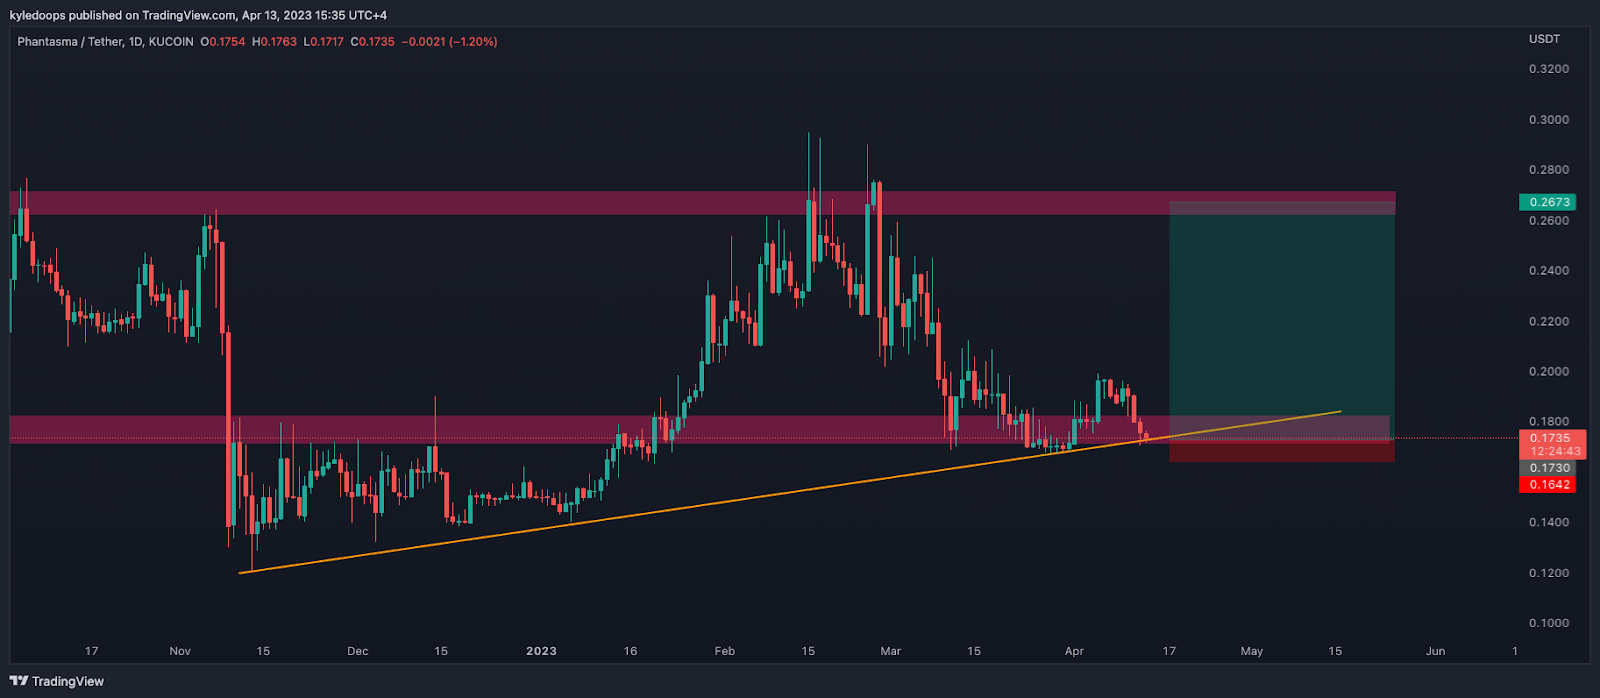
Chart #2 - Phantasma (SOULUSDT) 1-Day Chart
Chartist: Kyle
(For the chart screenshot, click here.)
SOUL is a gaming token that has a favorable risk-to-reward setup if the market bounces.
It's coming directly into horizontal support while simultaneously hitting a diagonal support line. There is no real narrative behind it other than the rotational game, from BTC to ETH to Alts.
If money flows as it usually does, then SOUL could catch a bid. My take profit is at 26 cents.
𝗣𝗿𝗶𝗺𝗲 𝗫𝗕𝗧
Sign up for a new Trading Account on Prime XBT!
Receive a deposit bonus of up to $7,000 with promo code: KyleDoops

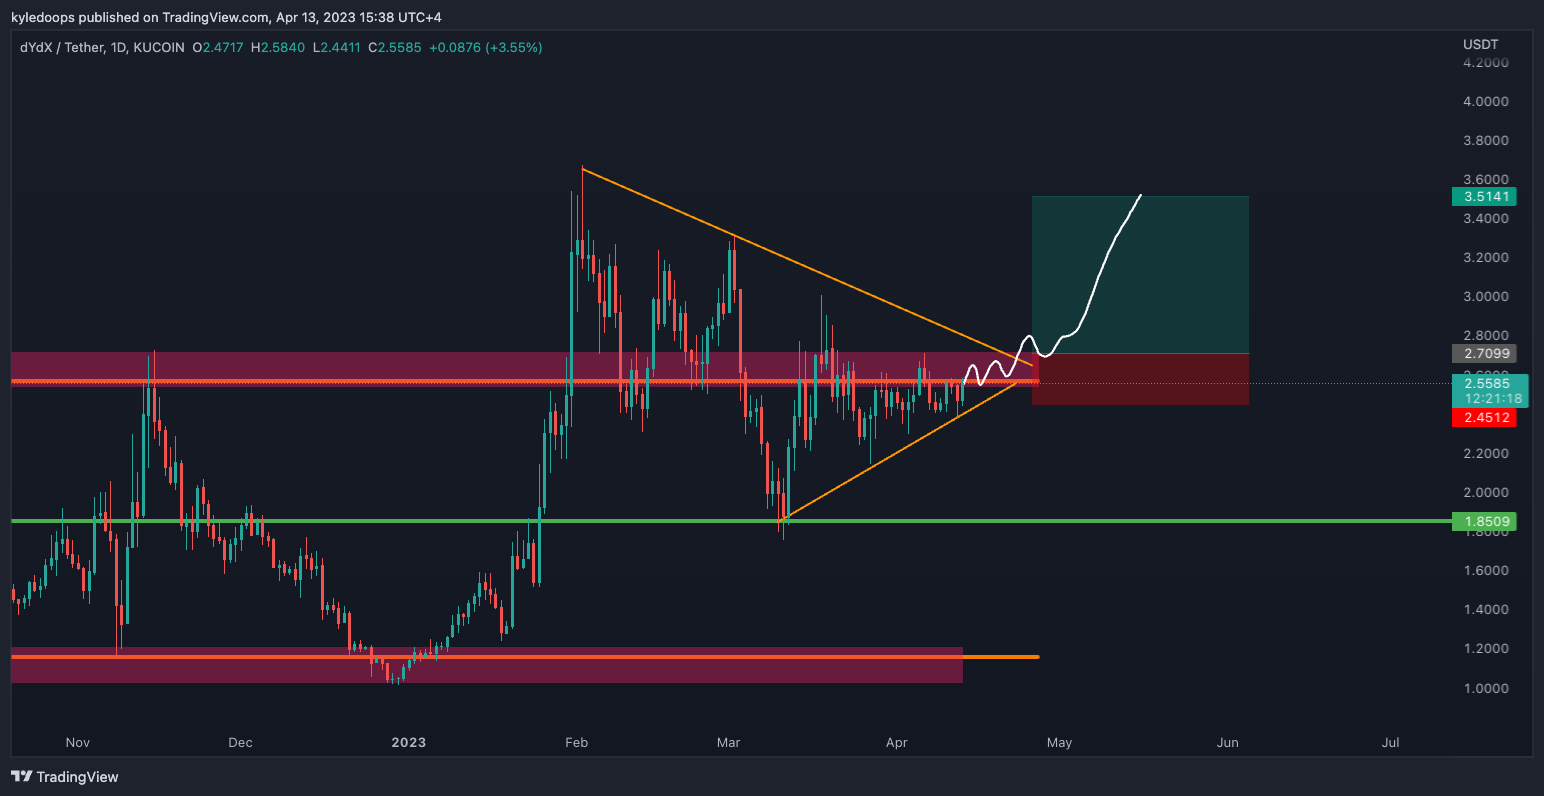
Chart #3 - dYdX (DYDXUSDT) 1-Day Chart
Chartist: Kyle
(For the chart screenshot, click here.)
Like SOUL, if the alt narrative picks up, then DYDX could be a potential gainer.
Note, for this trade to work out, we would first need to see the price break above the prior range high, then break the diagonal. On that break, an entry will open up for a long trade.
I have drawn a white line to showcase how it could play out. Stop losses should be placed below the prior lows, and invalidation occurs if the price breaks back into the range.
Claim your Bitget sign-up bonuses here (details below).
Chart #4 - Fantom (FTMUSDT) 1-Day Chart
Chartist: Sheldon

(For the chart screenshot, click here.)
Cash is starting to flow into some alts - like FTM.
Over the last week, FTM has gone from $0.45 to just over $0.51. It's trading within the $0.4950 - $0.52 resistance zone and the Stoch RSI on higher time frames is starting to indicate that FTM is overbought.
However, it could stay overbought for a while longer, as if it breaches $0.52, it may test $0.55 or even reach as high as $0.59 - $0.65.
If the price gets rejected here, FTM could retest the previous descending resistance line at around $0.4750 - $0.4800.
Claim your Bitget sign-up bonuses here (details below).
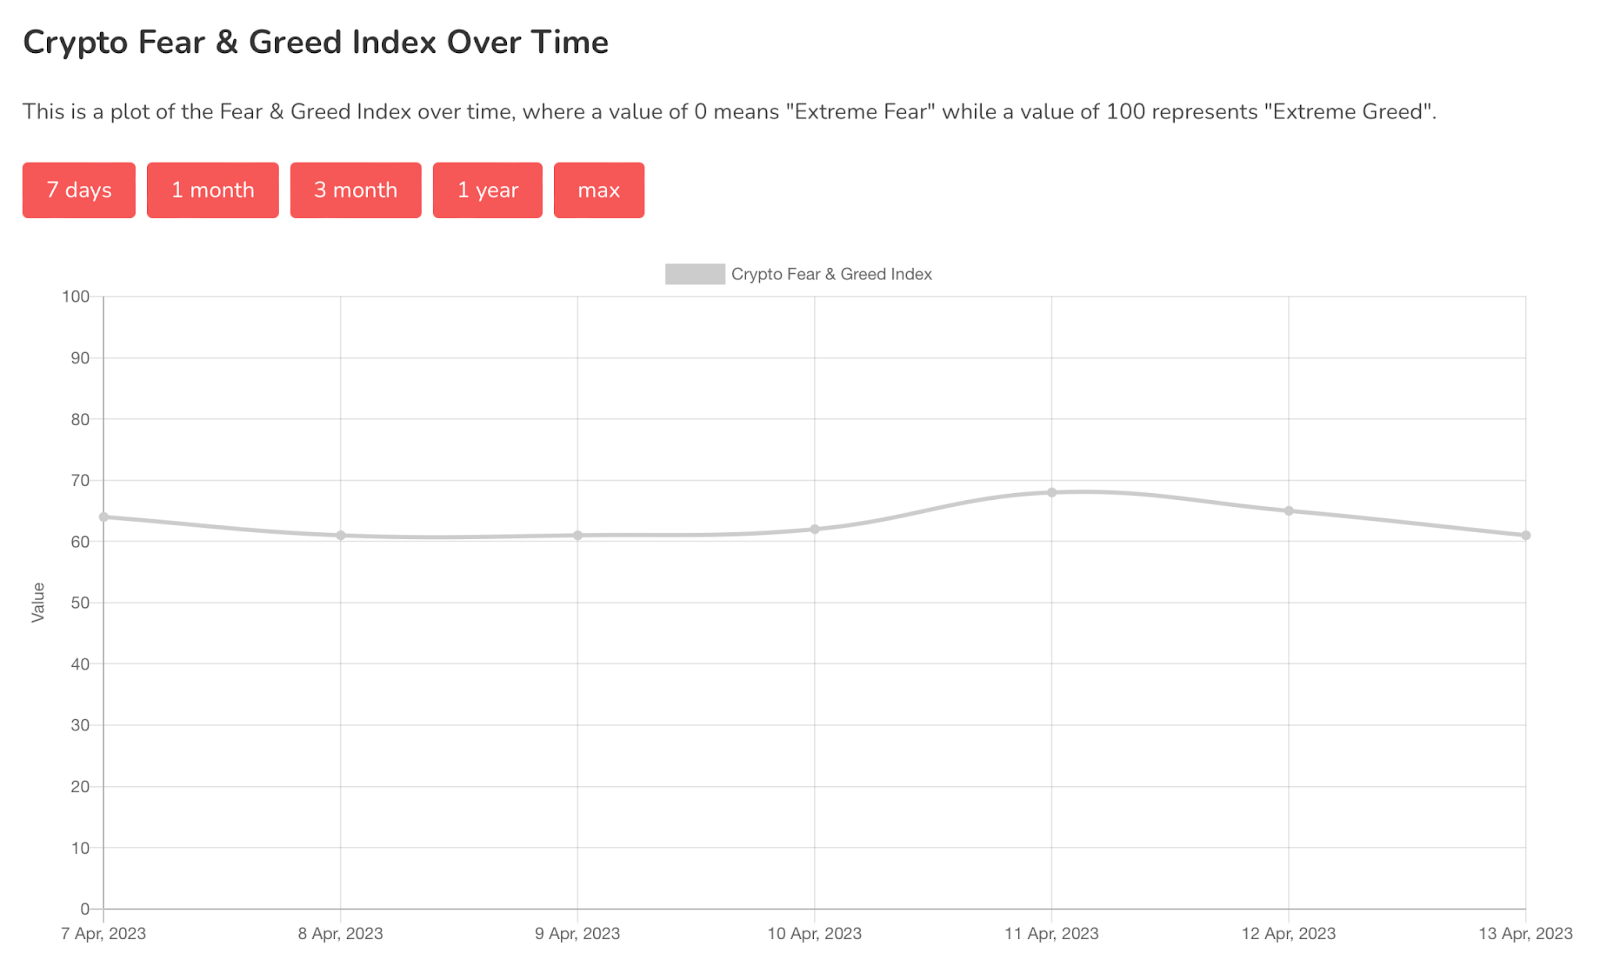
Chart #5 - Bitcoin Fear and Greed Index
The Bitcoin Fear and Greed Index is sitting at 61 today, indicating Greed.
The highest the index has been over the past seven days is 68, and the lowest is 61.
Overall Market Sentiment (Banter’s Take)
Bitcoin has a bearish divergence which could lead to lower prices, but if the sell-off is controlled, alts have a chance to rally.
The ETH/BTC ratio looks half decent right now, and BTC dominance is coming down. So long as this trend continues, we will look for altcoin plays.
Stay safe my friends!
Go to our Crypto Banter Discord here where Sheldon and Kyle give updates on the charts and trades from The Daily Candle newsletter!
Bybit winner - 7681004