

📈📉 An EASY Range Trade on ASTR? +35% Gains Incoming!
📈📉 An EASY Range Trade on ASTR? +35% Gains Incoming!
PLUS: NOT LONG Left to Take This RNDR Trade!
Overview
Chart #1 - Bitcoin (BTCUSDT) 12-Hour
Chart #2 - Kaspa (KASUSDT) 8-Hour
Chart #3 - Astar (ASTRUSDT) 8-Hour
Chart #4 - Render (RNDRUSDT) 8-Hour
Chart #5 - Fear and Greed Index
Chart #1 - Bitcoin (BTCUSDT) 12-Hour
Chartist: Sheldon

(For the chart screenshot, click here.)
Currently, BTC is hovering slightly beneath the resistance zone from $52,000 to $53,800.
I anticipate the price might either stabilize for a few days or experience a retracement to potentially hit the next support regions between $47,800 and $49,000, or even the minor support level near $46,000.
Should the price turn the $52,000 - $53,800 range into support, it could head to $56,000 and $58,000.
Sign-up and trade on Bybit today.
Exclusive $30,000 deposit rewards and bonuses up for grabs!
Chart #2 - Kaspa (KASUSDT) 8-Hour
Chartist: Kyle
(For the chart screenshot, click here.)
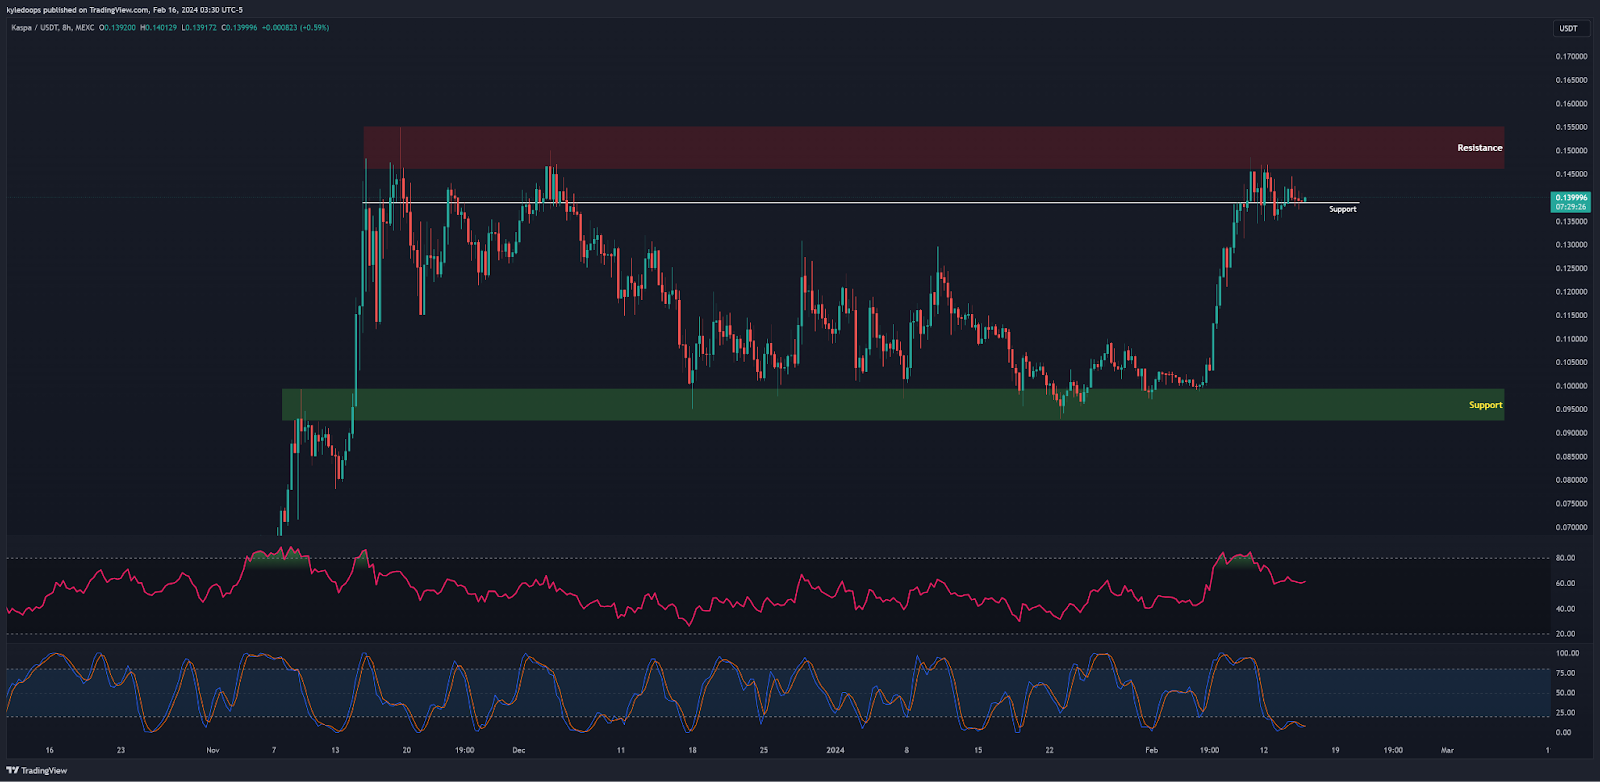
KAS is aiming for its all-time high (ATH) of $0.1527, once more surpassing its support level at $0.14, with a market cap exceeding $3.1 billion.
To increase its chances, it must break above $0.144.
Should it reject badly, it will eye $0.10!
Claim your Bitget sign-up bonuses here (details below).

Outsmart 99% Of The Market!
Get full access into our Discord And Telegram group, where you'll find all of our premium content!
👉 Trade Signals!
👉 Trade Set-Ups!
👉 Trading Challenges!
👉 Education!
👉 SO MUCH MORE!
Chart #3 - Astar (ASTRUSDT) 8-Hour
Chartist: Kyle
(For the chart screenshot, click here.)
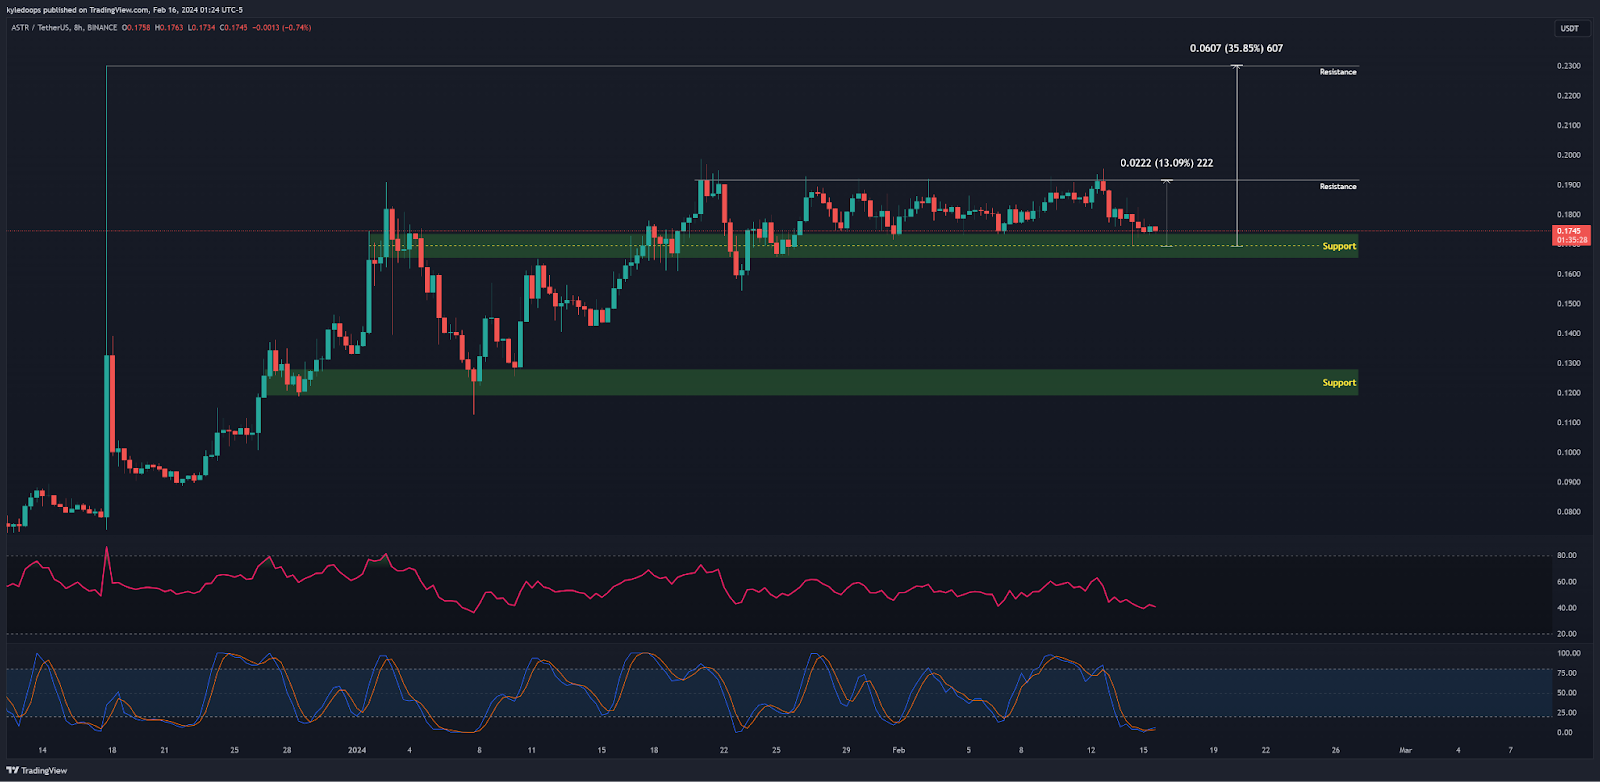
ASTR has a market cap of $972 million, and is presently consolidating and establishing support at $0.17.
For short-term traders who specialize in trading within ranges, the next target is $0.1915. When ASTR brakes and clears above the range, the next resistance will be $0.23 giving a move of 35%.
If the markets drop, the next support is at $0.12.
Claim your Bitget sign-up bonuses here (details below).
Chart #4 - Render (RNDRUSDT) 8-Hour
Chartist: Sheldon
(For the chart screenshot, click here.)
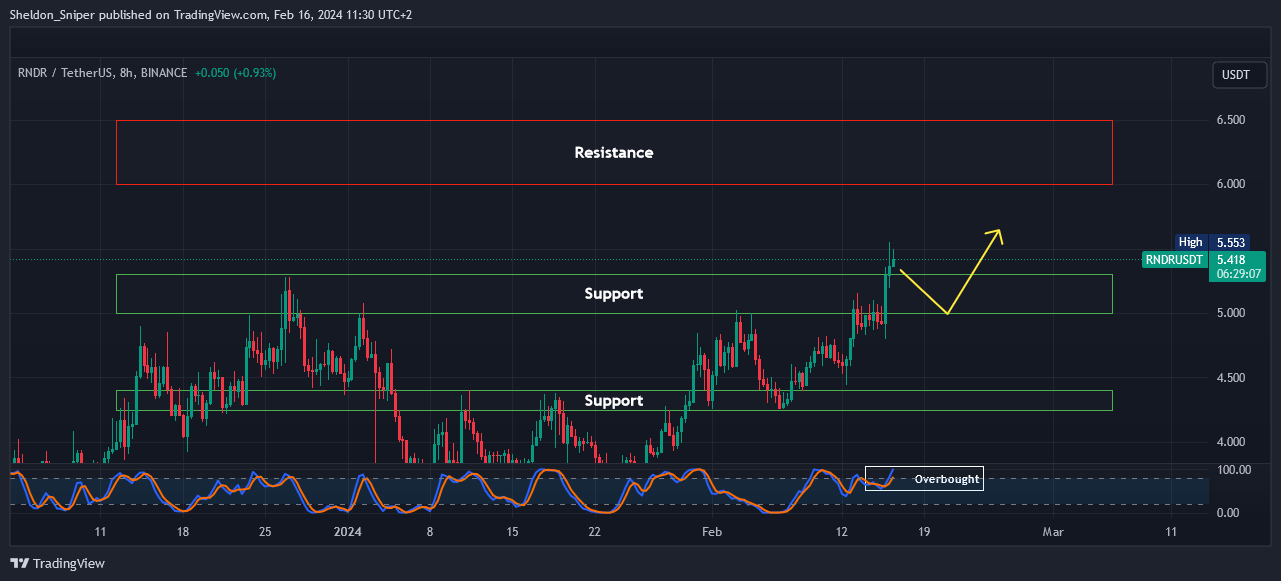
Yesterday, RNDR successfully breached the lower end of the $5.00 resistance zone and has since climbed to at $5.40.
I expect a retest of that breakthrough next. Should support become strong, I’ll take a long spot trade.
I’ll take profits at $6.00 and $6.50.
My stop-loss will be set slightly beneath the lowest price point from yesterday, at $4.80.
Claim your Bitget sign-up bonuses here (details below).
Chart #5 - Fear and Greed Index
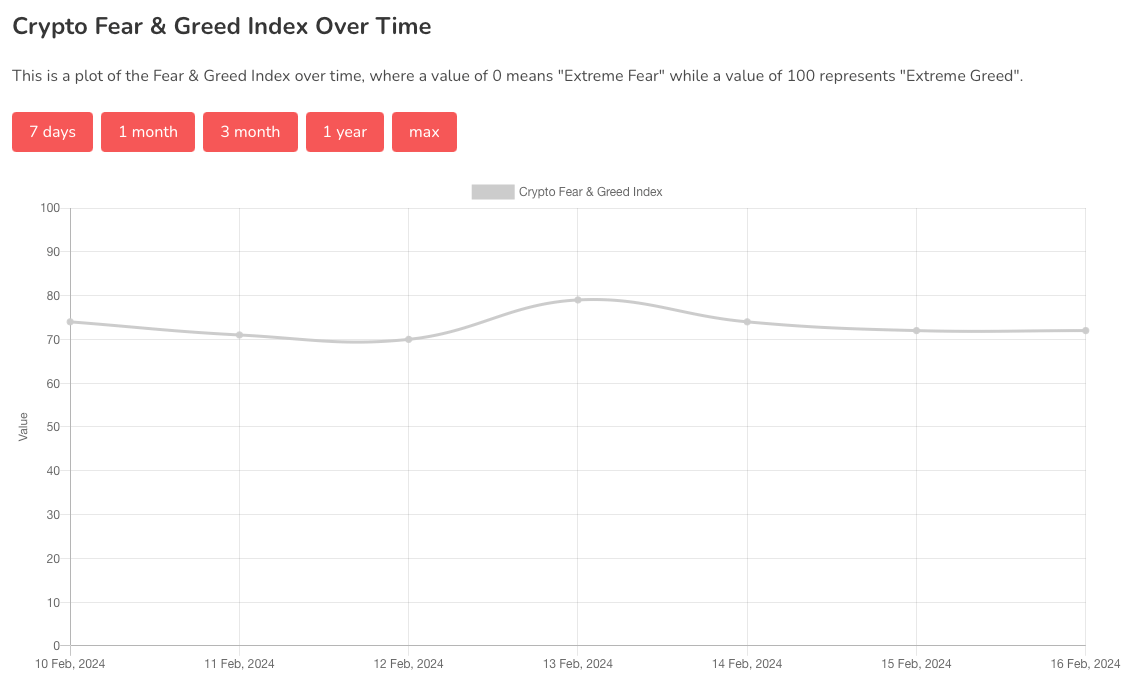
The Fear and Greed Index is sitting at 72 today, indicating Greed.
The highest the index has been over the past seven days is 79, and the lowest is 70.
Banter’s Take
With Bitcoin having pumped hard this week, some traders are calling for a pullback over the weekend, but the TA might not necessarily agree.
Make sure to practice caution in case it actually plays out. If not sure, tighten your stop losses!
Stay safe my friends!
Go to our Crypto Banter Discord here where Sheldon and Kyle give updates on the charts and trades from The Daily Candle newsletter!
Nice charts