Overview
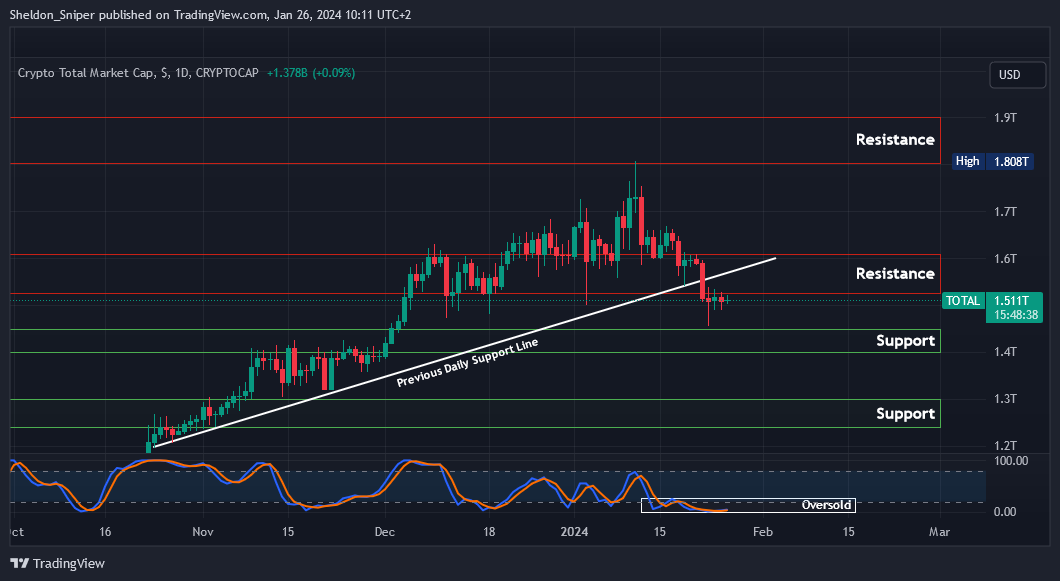
Chart #1 - Crypto Total Market Cap (TOTAL) Daily
Chart #2 - Dogecoin (DOGEUSDT) Daily
Chart #3 - ApeCoin (APEUSDT) Daily
Chart #4 - Chainlink (LINKUSDT) Daily
Chart #5 - Fear and Greed Index
Chart #1 - Crypto Total Market Cap (TOTAL) Daily
Chartist: Sheldon
(For the chart screenshot, click here.)
The TOTAL is testing the $1.52 trillion range low level of resistance.
The market is oversold on the daily. If the $1.52 trillion resistance level can be breached, the next resistance lies between $1.58T - $1.60T, where the previous daily support line can be found, adding to the resistance.
However, if the market is rejected at the $1.52 trillion resistance, it could potentially drop down to retest the $1.46 trillion support level once more.
Sign-up and trade on Bybit today.
Exclusive $30,000 deposit rewards and bonuses up for grabs!
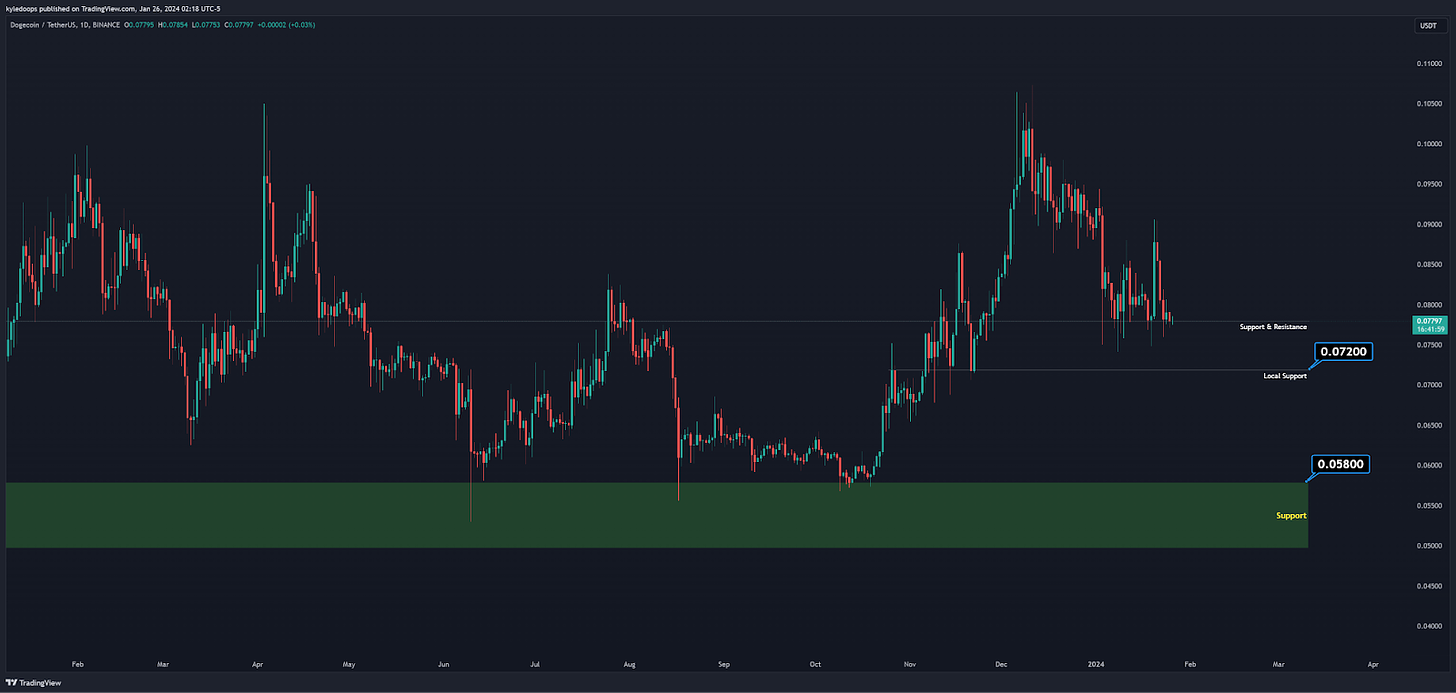
Chart #2 - Dogecoin (DOGEUSDT) Daily
Chartist: Kyle
(For the chart screenshot, click here.)
DOGE is currently on a very old support and resistance area.
The question is: will it bounce from here or continue its correction to the next local support at $0.072?
The next major support area is at $0.058, which will bring a great entry opportunity. For long-term traders, if in doubt, get a position, and later you will always have the ability to DCA to improve position sizing.
Claim your Bitget sign-up bonuses here (details below).
Outsmart 99% Of The Market!
Get full access into our Discord And Telegram group, where you'll find all of our premium content!
👉 Trade Signals!
👉 Trade Set-Ups!
👉 Trading Challenges!
👉 Education!
👉 SO MUCH MORE!
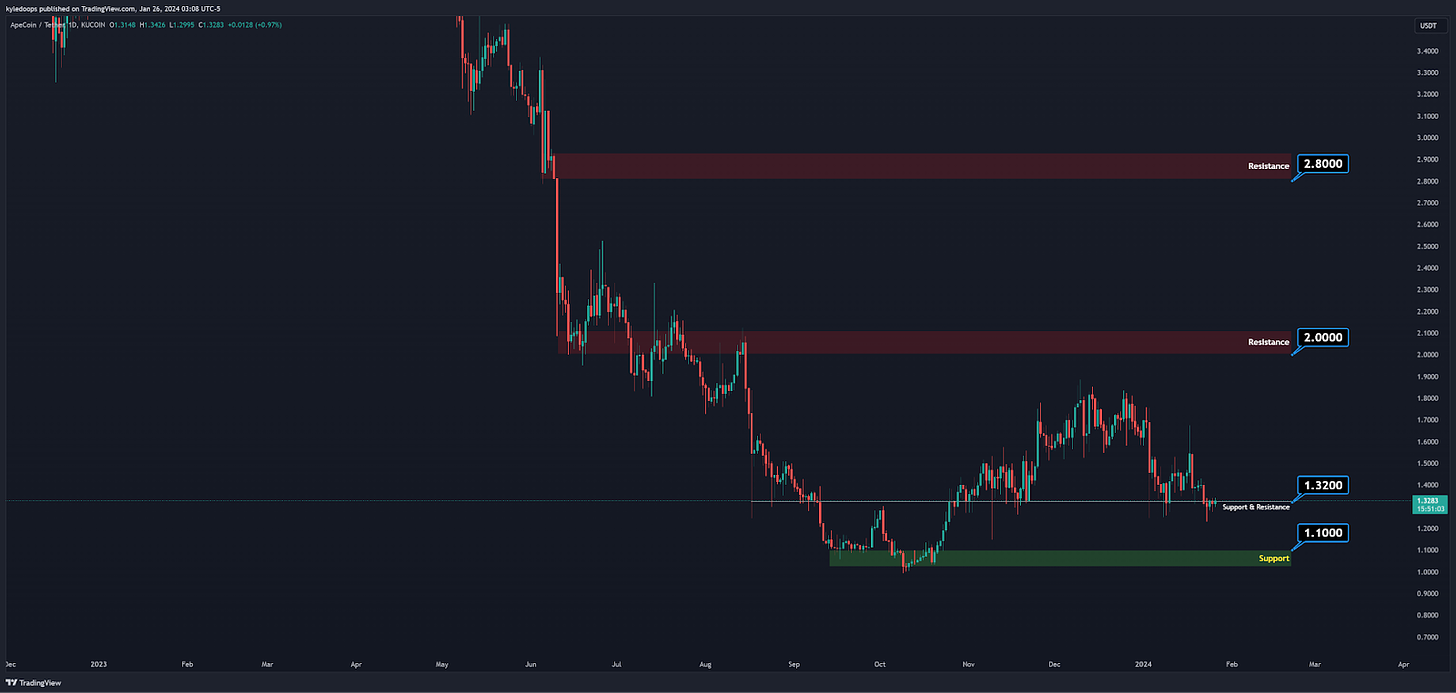
Chart #3 - ApeCoin (APEUSDT) Daily
Chartist: Kyle
(For the chart screenshot, click here.)
APE’s market cap is at $802 million, which doubled from the 23rd of January, possibly a precursor to strength when the bulls show up.
It rests on support and resistance at $1.32, with the next resistance at $2.00, followed by another at $2.80.
If Bitcoin continues down, APE may target the support below at $1.10.
Claim your Bitget sign-up bonuses here (details below).
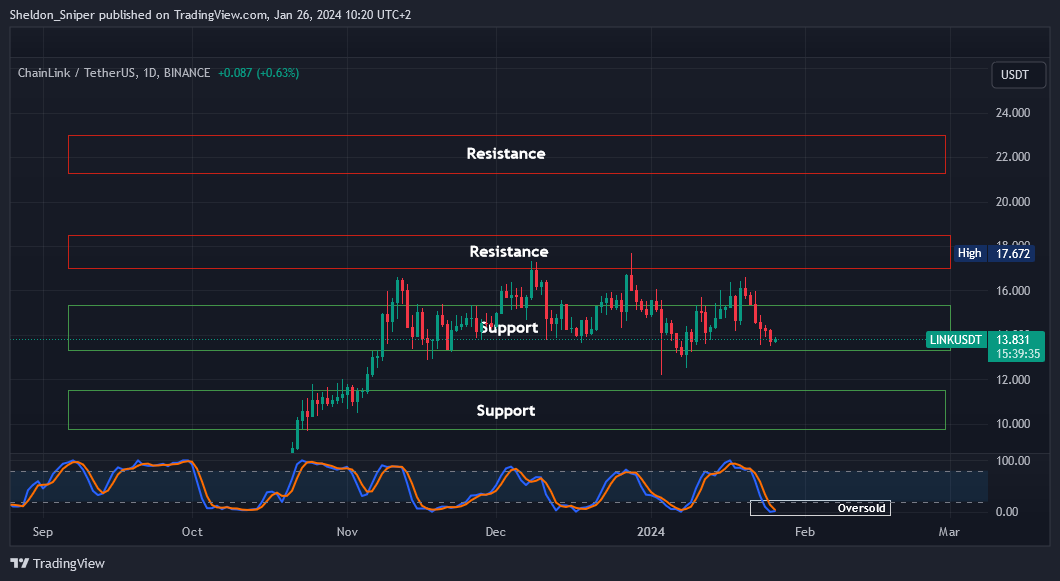
Chart #4 - Chainlink (LINKUSDT) Daily
Chartist: Sheldon
(For the chart screenshot, click here.)
LINK has showed bullish price action in recent weeks.
Currently, it's testing the lower end of the range at approximately $13.75. There's potential for upside in the coming weeks. The daily timeframe is oversold. If this support area holds, it could move upward to test resistance levels at approximately $17.00 - $18.25 or even the subsequent resistance at $21.30 - $23.00.
Claim your Bitget sign-up bonuses here (details below).
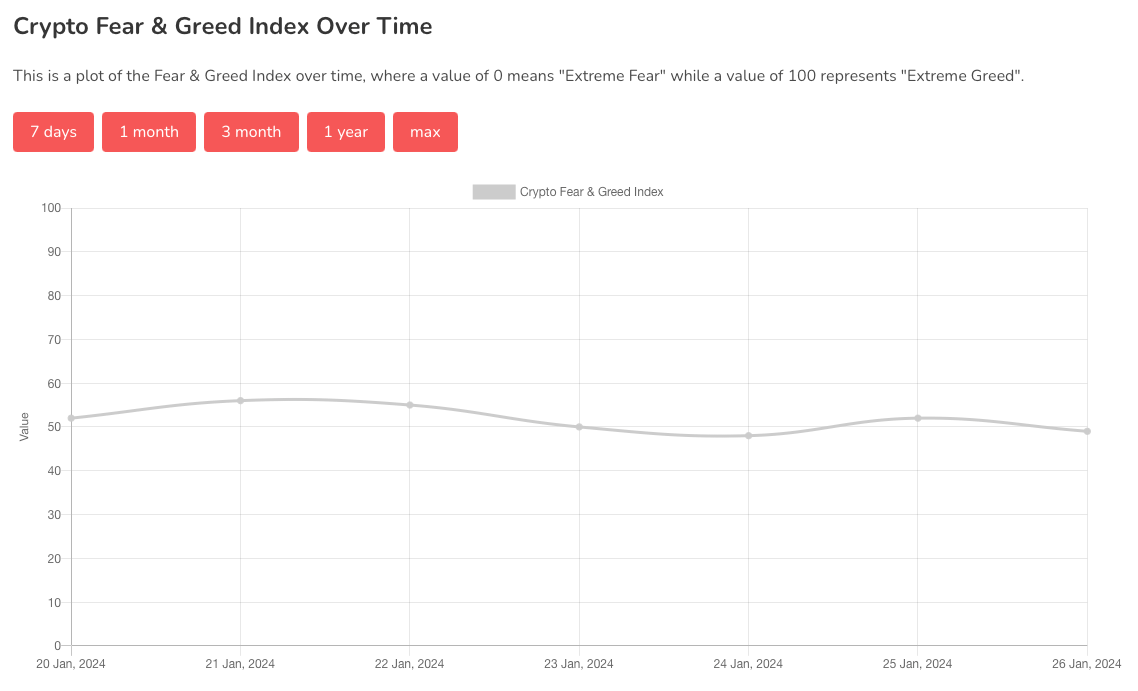
Chart #5 - Fear and Greed Index
The Fear and Greed Index is sitting at 49 today, Neutral.
The highest the index has been over the past seven days is 56, and the lowest is 48.
Banter’s Take
The bulls have not appeared yet, and it's evident that the bears are in control as Bitcoin struggles to surpass $40,200. This raises the question of whether it will continue to $35,500, go deeper to the $32,000 area, or return to an upward trajectory without a significant correction, as observed since December 2022. The ascending triangle has everyone on edge.
Stay safe my friends!
Go to our Crypto Banter Discord here where Sheldon and Kyle give updates on the charts and trades from The Daily Candle newsletter!



Tell Ran that I will build his expo for him - He doesn't have to spend a cent. I have to be a bit arrogant and completely truthful, I have the best team in South Africa to set up events, and I can prove it. I have already done much of the groundwork as I was planning to do a crypto event, It was planned for this year but I couldn't get the venue that I wanted, I have it now. I'm Joburg based I will fly down with my team to meet with Ran and any in the crypto team involved. I have proven that I'm the worst trader in crypto, but no one can touch me in exhibitions and events