

📈📉 Are bears taking back control of the alts? This level must be reclaimed!
📈📉 Are bears taking back control of the alts? This level must be reclaimed!

Bitget winner - 8865231727
Wondering what that 👆 is and how you can win? Then check out our daily shows on YouTube!
Are you using Bybit instead? Then look for the winning Bybit account below. But if you want to double your chances of winning, sign up today to both exchanges with the links found in the description of our YouTube videos!
Good luck to all!
Chart #1 - Ethereum (ETHUSDT) 12-Hour Chart
Chartist: Sheldon

(For the chart screenshot, click here.)
Last week ETH dropped from $1,700 to $1,500 (support) and has been consolidating there for the past two days.
The drop could be the start of a deeper dive that sees ETH test lower support levels one at a time - as opposed to going down in a straight line. ETH may first test $1,550 - $1,600 during the week, as it hasn't revisited that area since the drop. If for whatever reason ETH breaks through there, the next areas of resistance are at $1,700 and $1,800.
But if ETH does head down, the next levels of support are at $1,400, followed by the previous daily resistance line at $1,300.
Check our Crypto Banter Discord here for updates!
Follow me on Twitter for urgent updates on my trading progress!
Claim your Bitget sign-up bonuses here (details below).
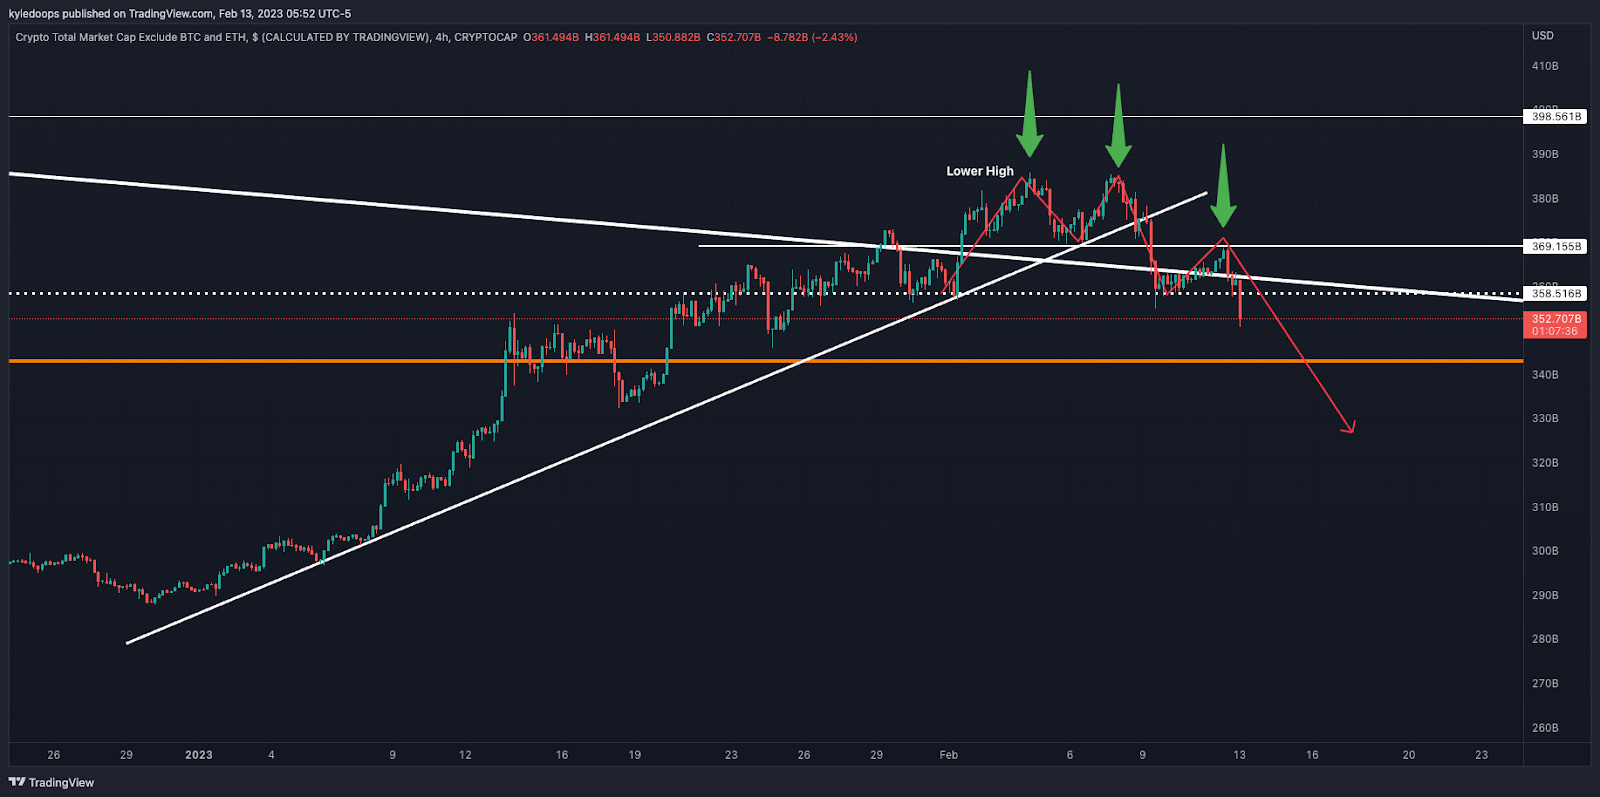
Chart #2 - TOTAL3 4-Hour Chart
Chartist: Kyle
(For the chart screenshot, click here.)
The TOTAL3 has now printed another lower high on its 4-hour chart and looks to be distributing.
If the TOTAL3 fails to reclaim the $370 billion level soon, it would mean that prices are likely to continue heading down and, subsequently, bears will take back control.
However, a quick reclaim of $370 billion would be incredibly bullish and likely a bear trap.
Check our Crypto Banter Discord here for updates!
Make sure to follow me on Twitter, where I will post updates on my trades as they unfold!
Claim your Bitget sign-up bonuses here (details below).
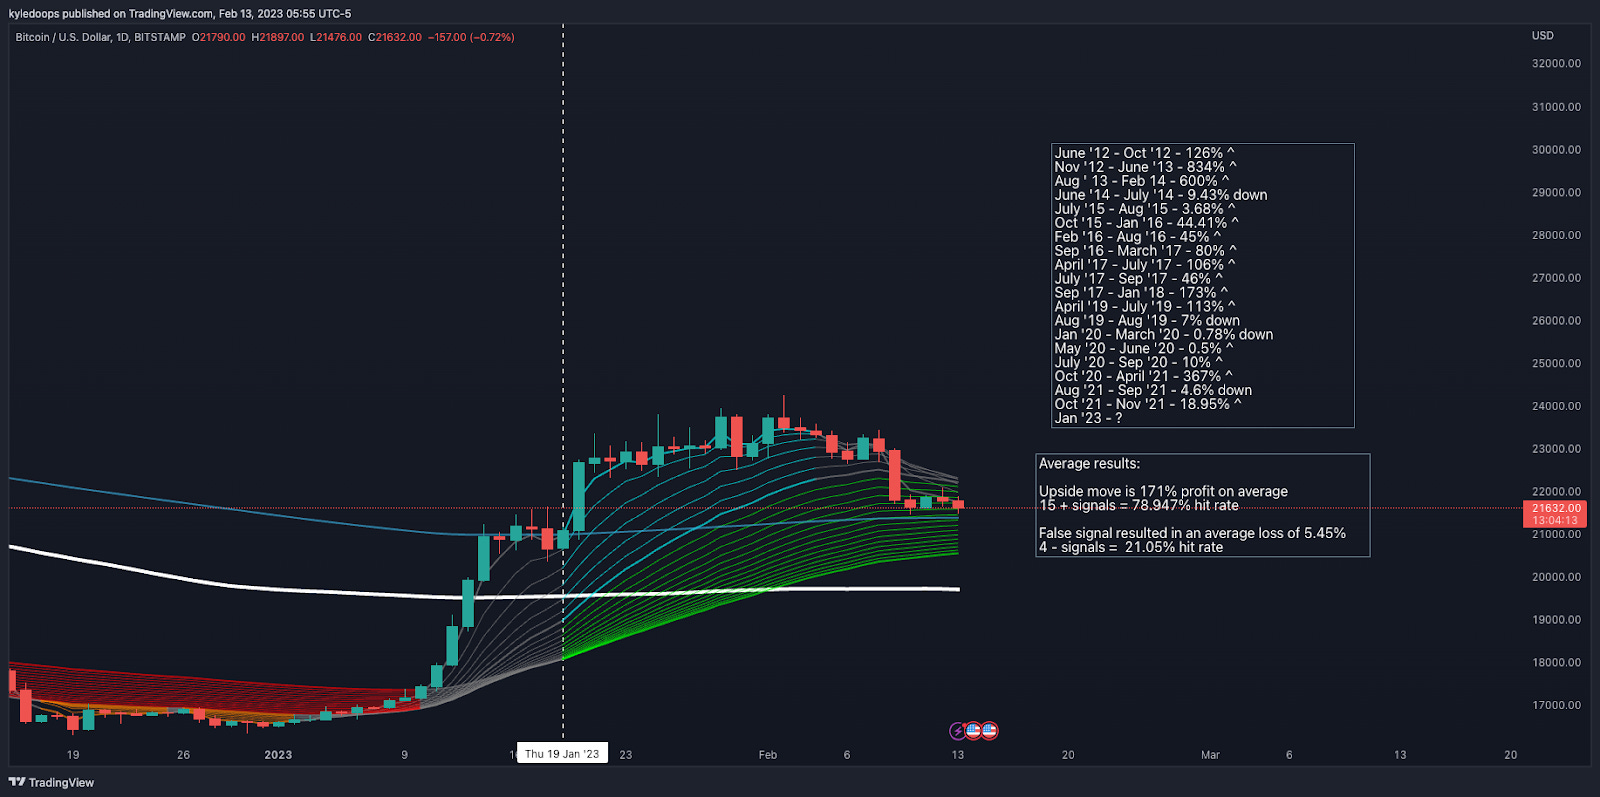
Chart #3 - Bitcoin (BTCUSD) 1-Day Chart
Chartist: Kyle
(For the chart screenshot, click here.)
Looking at bitcoin on the daily chart with the super guppy indicator overlaid, it fired a buy signal on the 19th of January. But how reliable is that?
Backtesting the indicator, it has given accurate buy signals 15 out of 19 times (78.9% accuracy) with an average gain of 171%. False signals occurred 4 out of the 19 times (21.05% accuracy) and led to a drawdown of 5.45% before firing the close trade signal.
So essentially, as long as bitcoin is above $19,700 (the 200-day moving average) the buy signal is viable, and all dips should be treated as BTC longing opportunities.
Check our Crypto Banter Discord here for updates!
Make sure to follow me on Twitter, where I will post updates on my trades as they unfold!
Claim your Bitget sign-up bonuses here (details below).
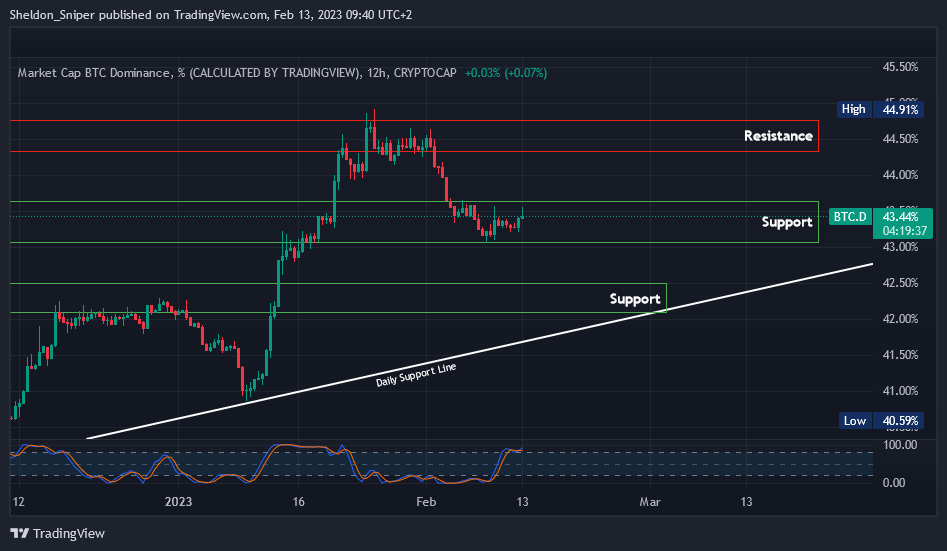
Chart #4 - Bitcoin Dominance (BTC.D) 12-Hour Chart
Chartist: Sheldon
(For the chart screenshot, click here.)
In the first week of February, BTC Dominance dropped from 44.5% (resistance) down to 43.5% (support), where, over the last week, it has been trending sideways and consolidating. If it moves up to retest previous areas of support, the first one is at 44%.
If BTC Dominance drops from the current level, the next areas of support come in at 42.5% and below that at the daily support line from November, at 42%.
A drop in BTC.D from current levels would be very bullish for the general altcoin market.
Check our Crypto Banter Discord here for updates!
Follow me on Twitter to get all the updates on my personal trading progress!
Claim your Bitget sign-up bonuses here (details below).
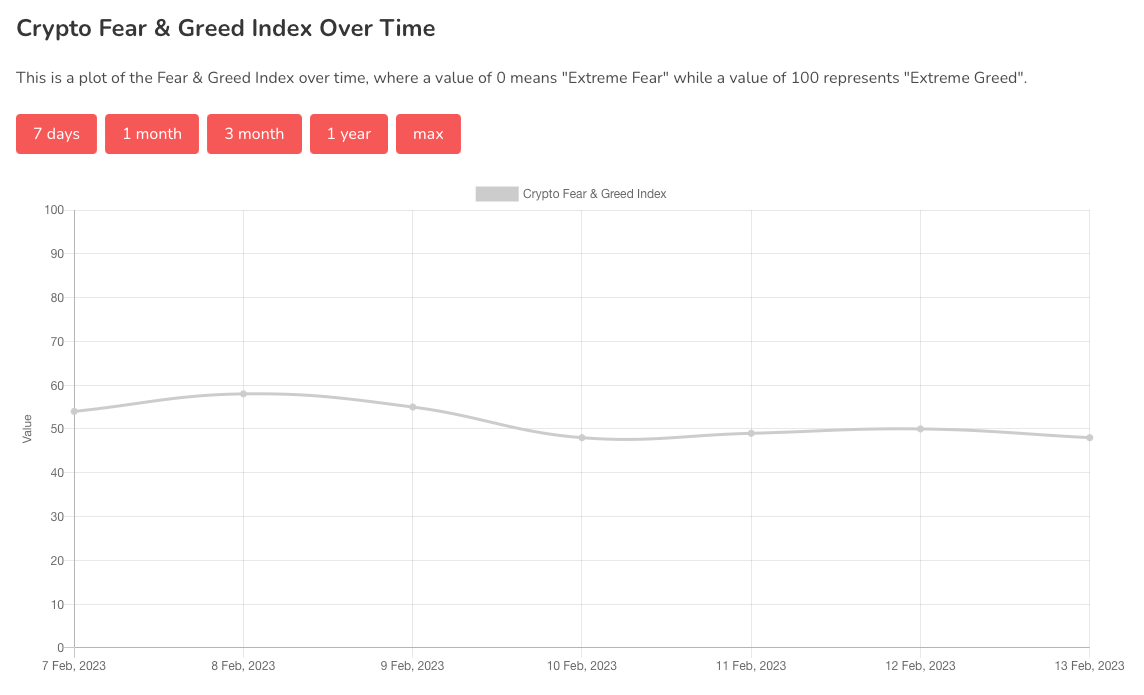
Chart #5 - Bitcoin Fear and Greed Index
The Bitcoin Fear and Greed Index is sitting at 48 today, Neutral.
The highest the index has been over the past seven days is 58, and the lowest is 48.
Overall Market Sentiment (Banter’s Take)
While bitcoin remains above its 200-day moving average, BTC traders should be on a higher low watch. Altcoins, however, remain risky as the TOTAL3 index is beginning to distribute.
Stay safe my friends!
Bybit winner - 26733839