

📈📉 Are we bound to revisit $18k? These are the crucial levels to watch!
📈📉 Are we bound to revisit $18k? These are the crucial levels to watch!

Bitget winner - 4066769037
Wondering what that 👆 is and how you can win? Then check out our daily shows on YouTube!
Are you using Bybit instead? Then look for the winning Bybit account below. But if you want to double your chances of winning, sign up today to both exchanges with the links found in the description of our YouTube videos!
Good luck to all!
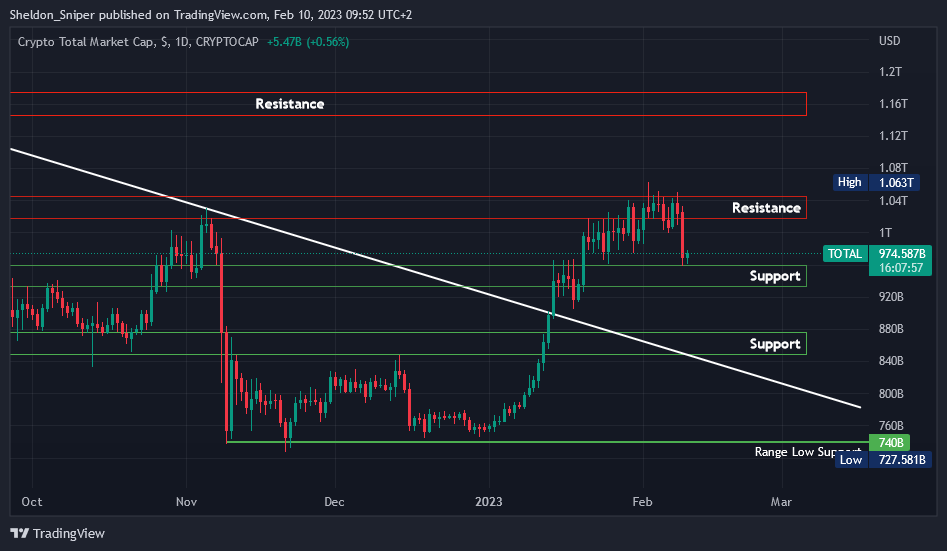
Chart #1 - TOTAL 1-Day Chart
Chartist: Sheldon
(For the chart screenshot, click here.)
Last night the Total Crypto Market Cap (TOTAL) got rejected at the $1.04T area of resistance, a level that it has been unable to break through over the past week.
The TOTAL has retraced down to support at $960B which, for now, seems to be holding. There is a possibility the TOTAL goes up from here to retest the break of the $1T level, an area that will now be acting as resistance. But then, I expect the TOTAL to carry on correcting downward, to test the lower support levels at $840B - $880B, and $800B.
If the TOTAL breaks through $1.04T, the next level of resistance is at $1.16T.
Check our Crypto Banter Discord here for updates!
Follow me on Twitter for urgent updates on my trading progress!
Claim your Bitget sign-up bonuses here (details below).
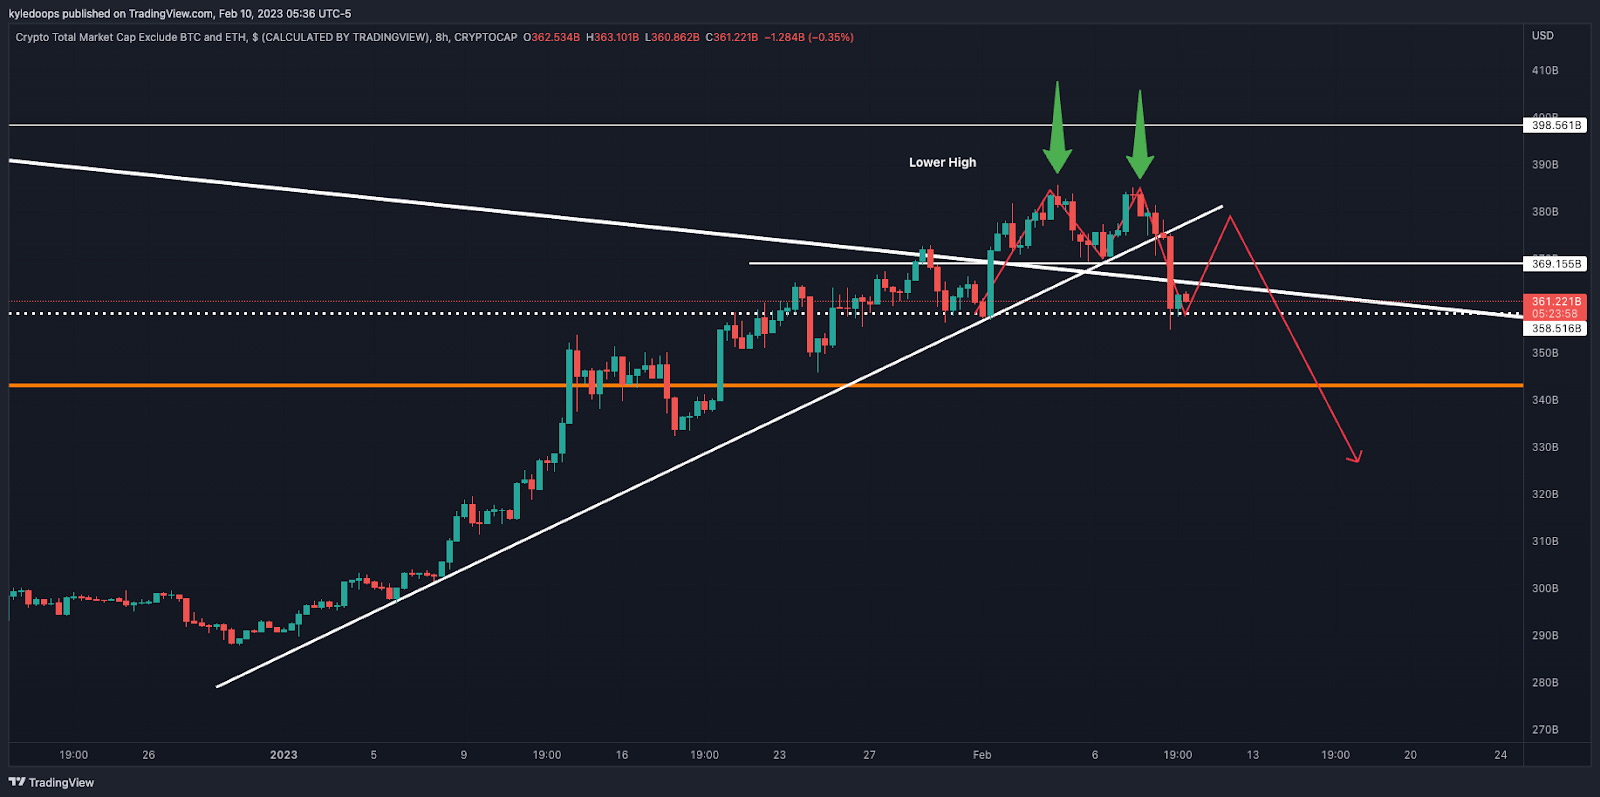
Chart #2 - TOTAL3 8-Hour Chart
Chartist: Kyle
(For the chart screenshot, click here.)
Yesterday we outlined a potential double-top scenario playing out, with what a trigger plan would look like if this played out to the downside.
The first scenario has occurred, which is a break of the diagonal trend line. Support is being established at around $358 billion. So now we watch the bounce.
If the TOTAL3 rejects from $370 billion, it would mean a bearish re-test and confirmation that full-on distribution likely plays out. That would mean most altcoins will revisit their range lows.
Check our Crypto Banter Discord here for updates!
Make sure to follow me on Twitter, where I will post updates on my trades as they unfold!
Claim your Bitget sign-up bonuses here (details below).

Last week we looked at some advanced options trading strategies. This week as promised we will look at Greeks in Options Trading. Please note that this is for educational purposes only.
Greeks in options trading are a set of metrics used to measure different factors that affect the price of an option. These metrics are called "Greeks" because they are denoted by Greek letters (Delta, Gamma, Theta, Vega, and Rho).
Here's a brief explanation of each of the Greeks:
Delta: measures the sensitivity of an option's price to changes in the underlying stock price. Delta can be thought of as the probability that the option will end up in-the-money at expiration.
Gamma: measures the rate of change of delta with respect to changes in the underlying stock price. In other words, it measures how quickly delta will change as the stock price moves.
Theta: measures the rate at which the option's price will decrease over time, also known as time decay.
Vega: measures the sensitivity of an option's price to changes in the implied volatility of the underlying stock.
Rho: measures the sensitivity of an option's price to changes in interest rates.
These metrics can be used by options traders to help manage risk and make informed trading decisions. By understanding the Greeks, traders can make informed decisions about when to buy or sell options, and how to adjust their positions to changes in the market.
See you all next Friday for our next lesson on options trading, as we go over some more advanced techniques!
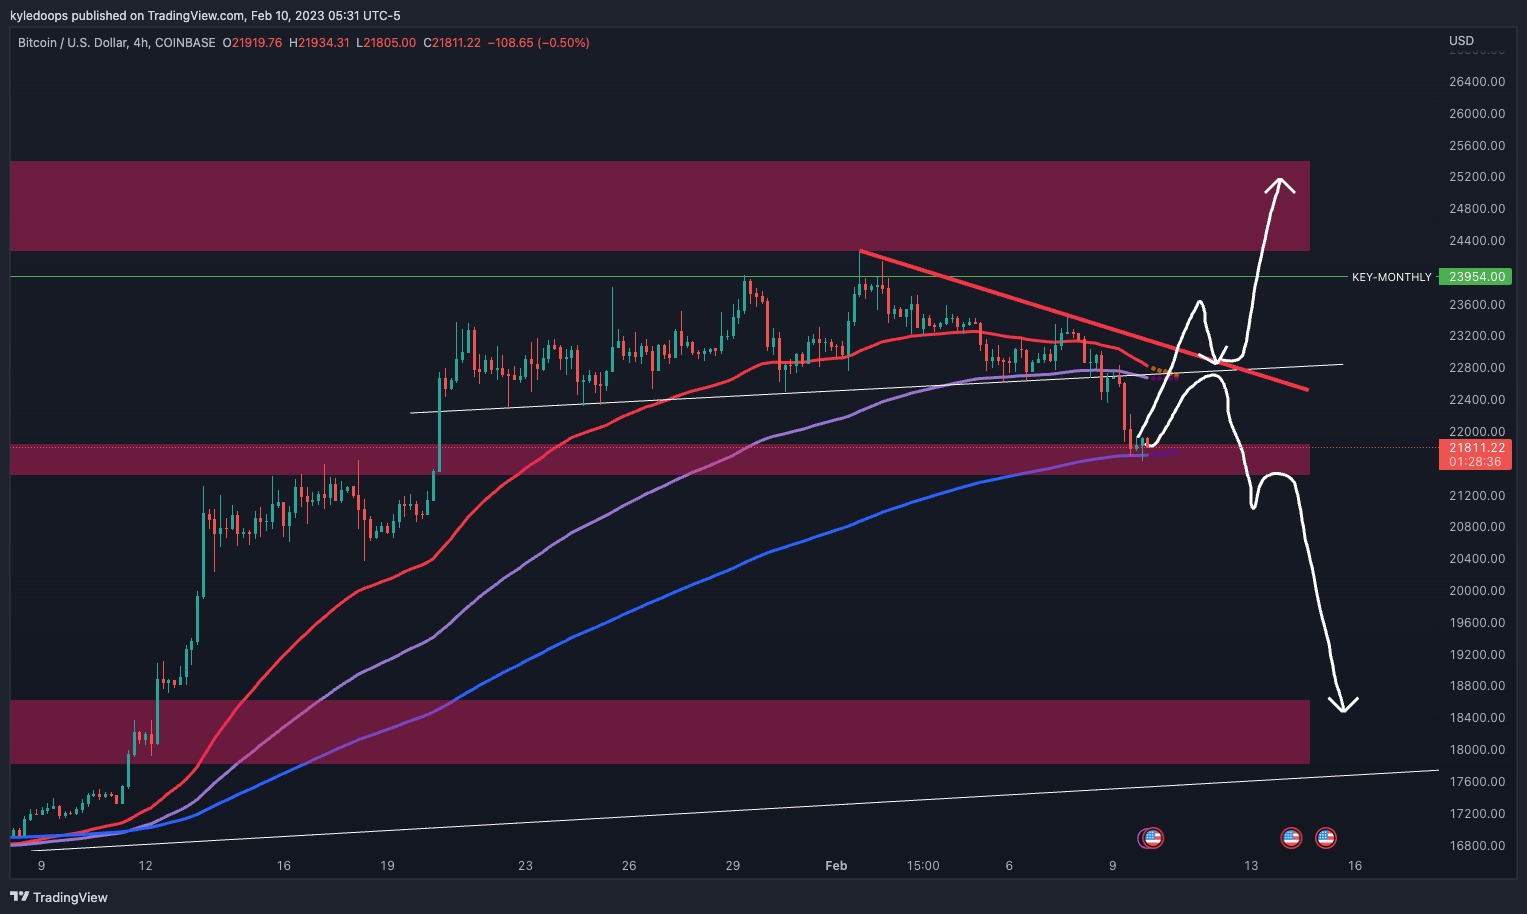
Chart #3 - Bitcoin (BTCUSD) 4-Hour Chart
Chartist: Kyle
(For the chart screenshot, click here.)
On the 4-hour chart, bitcoin is moving into a support zone which also happens to line up with key EMAs on both the daily and 4-hour charts.
If bitcoin successfully bounces from its 200 EMA, what it does next is critical.
A reclaim of $23,000 would be bullish and likely mean bears are trapped, as it would mean not only a break back into the range but also a break of the red down-sloping trend line.
A rejection, on the other hand, would mean a bearish re-test, and the mid-range at $21,000 would likely break, sending the price as low as $18,000 again.
Check our Crypto Banter Discord here for updates!
Make sure to follow me on Twitter, where I will post updates on my trades as they unfold!
Claim your Bitget sign-up bonuses here (details below).
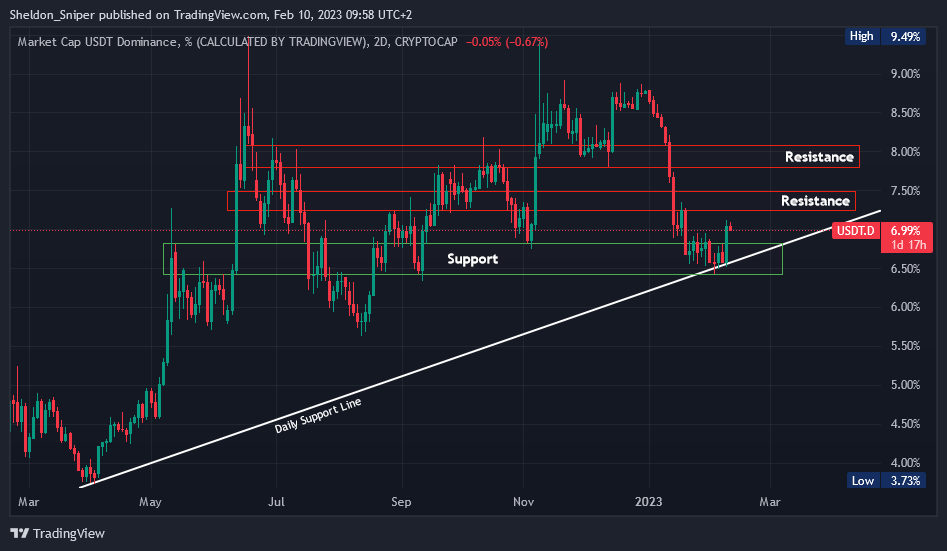
Chart #4 - USDT Dominance (USDT.D) 2-Day Chart
Chartist: Sheldon
(For the chart screenshot, click here.)
In January, USDT.D trended down as cash left USDT and entered the trading coins. We saw how the crypto market rallied over that time.
USDT.D went from around 8.7% at the beginning of January all the way down to the 6.5% area of support, where it has been consolidating for the last three weeks. Over this time, USDT Dominance has been unable to break its daily ascending support line, which has been in play since November 2021.
Overnight, USDT.D started to move up once again.
If it continues the trend, USDT.D could visit the next major resistance levels of 7.4% - 7.5%, and 7.8% - 8.3%, which would result in the crypto trading market correcting downward.
Check our Crypto Banter Discord here for updates!
Follow me on Twitter to get all the updates on my personal trading progress!
Claim your Bitget sign-up bonuses here (details below).
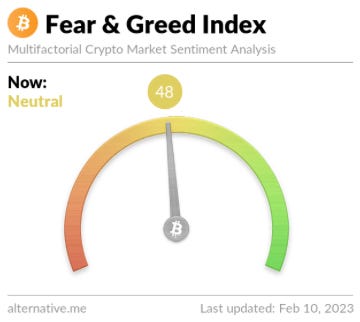
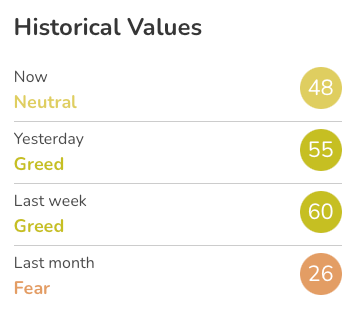
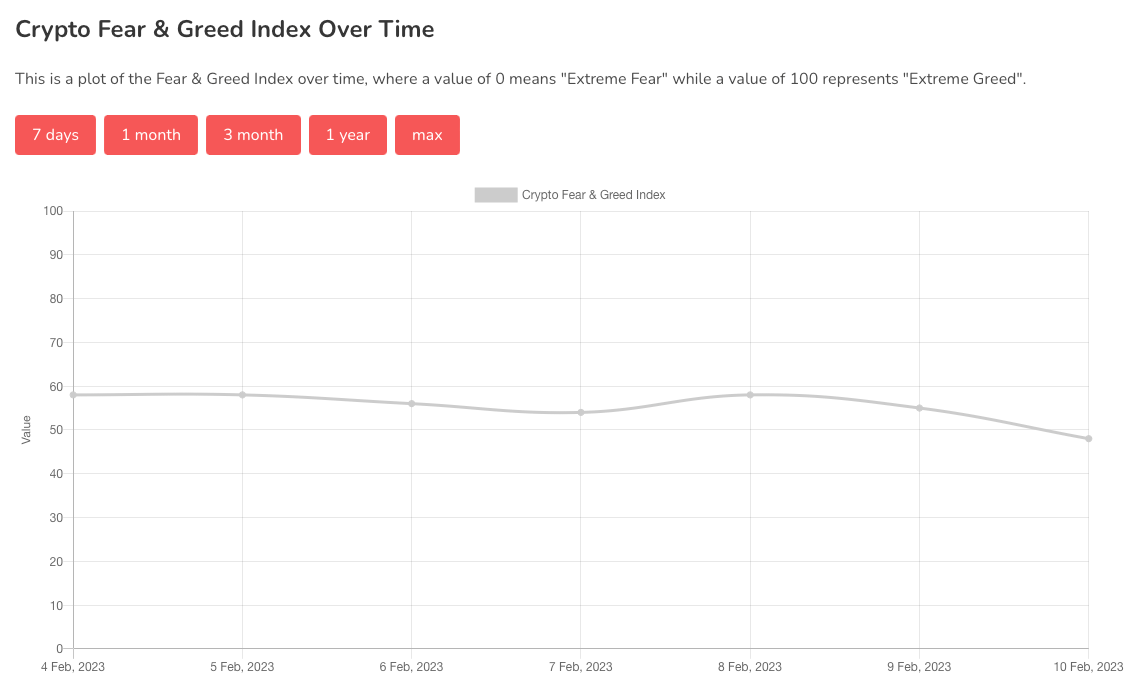
Chart #5 - Bitcoin Fear and Greed Index
The Bitcoin Fear and Greed Index is sitting at 48 today, Neutral.
The highest the index has been over the past seven days is 58, and the lowest is 48.
Overall Market Sentiment (Banter’s Take)
Everyone will be on a higher low watch for all coins on their daily charts. If higher lows can be found, prices will likely rally aggressively in the coming weeks.
If not, a quick sell-off should be expected as bulls panic out of their positions.
Stay safe my friends!
Bybit winner - 8175907