

📈📉 Arweave loses crucial level! But this token could be a buy!
📈📉 Arweave loses crucial level! But this token could be a buy!

Bitget winner - 4220697116
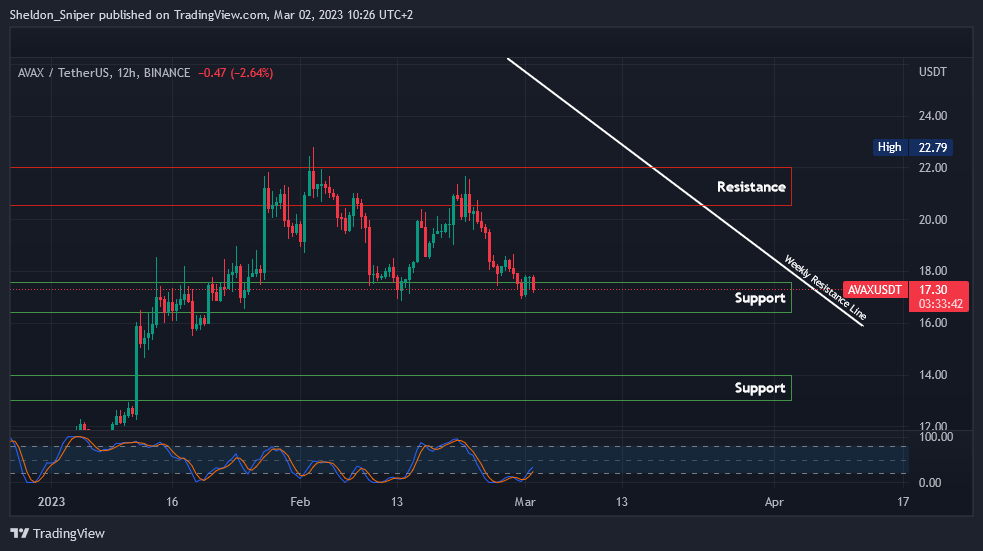
Chart #1 - Avalanche (AVAXUSDT) 12-Hour Chart
Chartist: Sheldon
(For the chart screenshot, click here.)
AVAX has been trading between $17.00 (support) and $21.00 (resistance) for the last six weeks.
Currently near $17.00, with the higher time frame indicators oversold, there is a possibility of AVAX moving up to test the range-high resistance of $21.00.
I will continue trading the range for now, but we must understand that this is obviously all US stock market and bitcoin dependent. If the range-low support at $17.00 breaks, the next significant support is between $13.00 - $14.00.
Check our Crypto Banter Discord here for updates!
Follow me on Twitter for urgent updates on my trading progress!
Claim your Bitget sign-up bonuses here (details below).
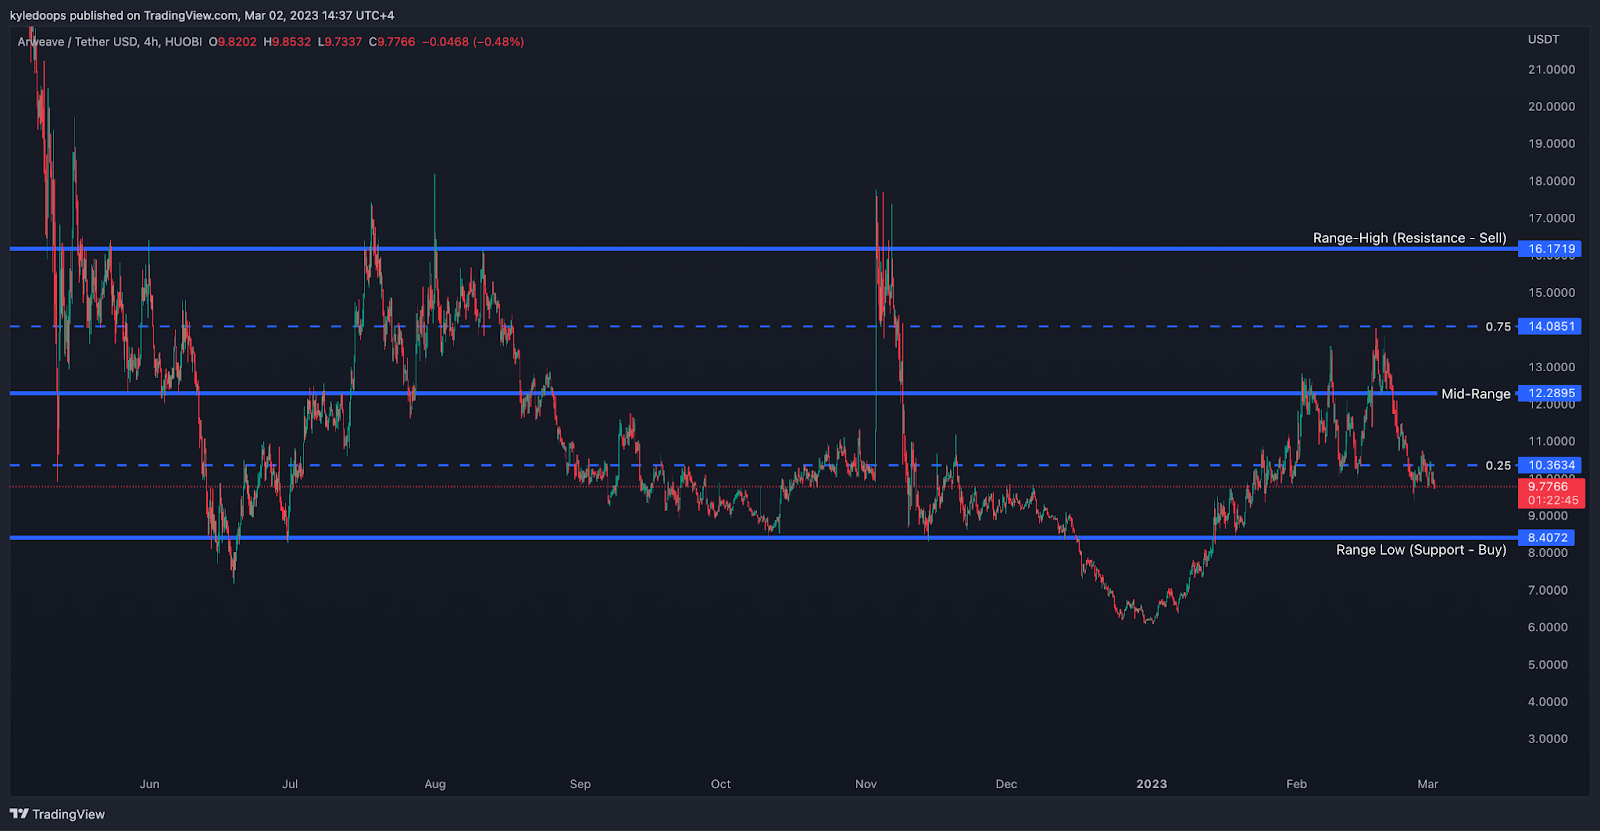
Chart #2 - Arweave (ARUSDT) 4-Hour Chart
Chartist: Kyle
(For the chart screenshot, click here.)
AR lost the 0.25 level of the range it's trading within and is now approaching the range low at $8.40.
That is a buy zone for the long term.
We might see a sweep of the lows, and the price quickly move back into the range. That would be the signal to go long.
Check our Crypto Banter Discord here for updates!
Make sure to follow me on Twitter, where I will post updates on my trades as they unfold!
Claim your Bitget sign-up bonuses here (details below).
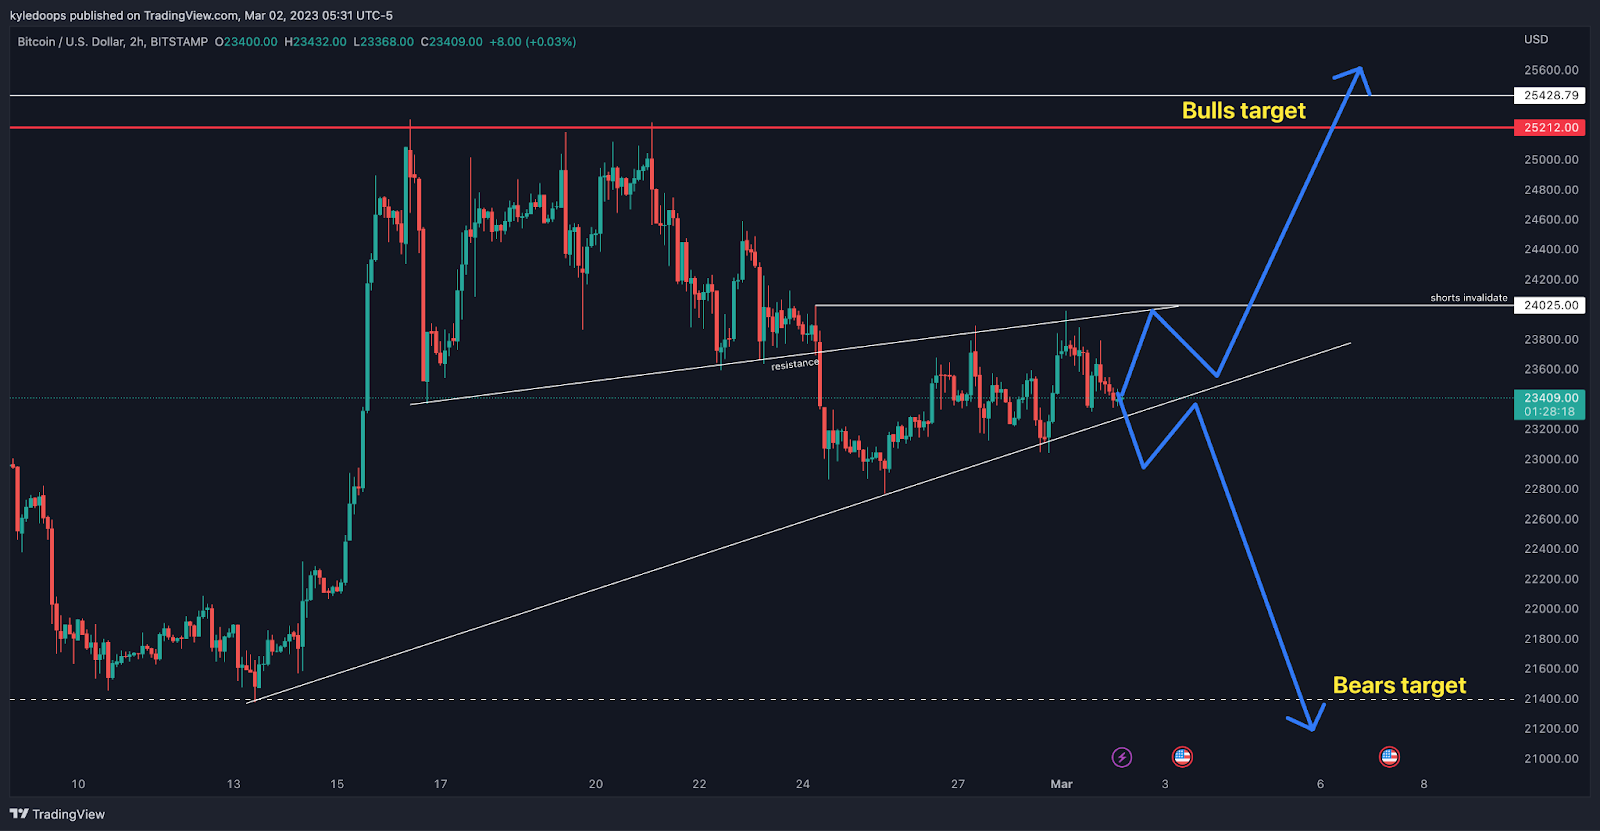
Chart #3 - Bitcoin (BTCUSD) 2-Hour Chart
Chartist: Kyle
(For the chart screenshot, click here.)
As far as short-term traders are concerned, bitcoin is still in no man's land while the price continues consolidating.
Bears will be targeting $21,400, while bulls will be aiming for $25,200 or above. Shorts will have their stop losses placed just above $24,050, and longs will have theirs just below $22,700.
We must be vigilant and beware of stop-hunts that would liquidate us. We will only be able to confirm what the next move may be once bitcoin closes above or below the mentioned stop levels.
Check our Crypto Banter Discord here for updates!
Make sure to follow me on Twitter, where I will post updates on my trades as they unfold!
Claim your Bitget sign-up bonuses here (details below).
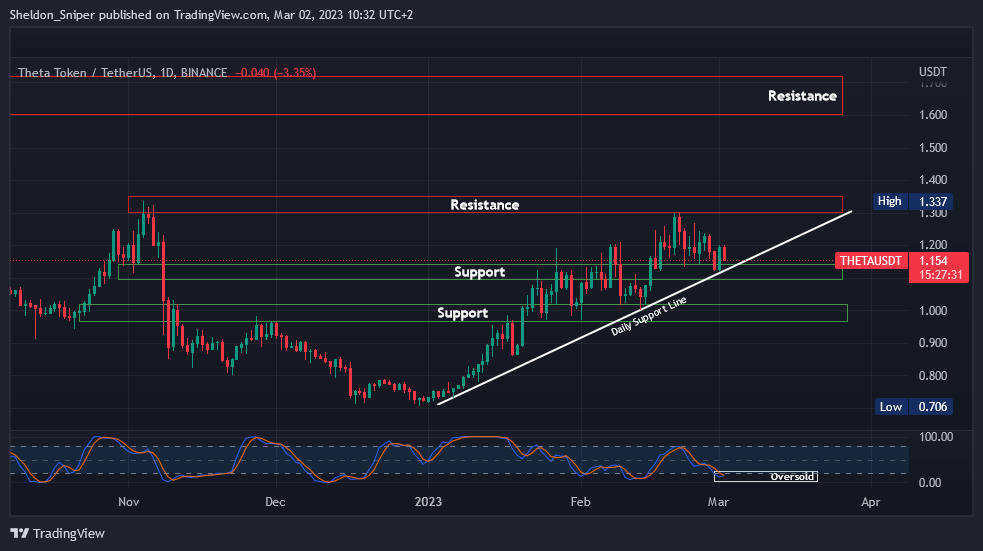
Chart #4 - Theta Network (THETAUSDT) 1-Day Chart
Chartist: Sheldon
(For the chart screenshot, click here.)
THETA could once again be a buy, with prices currently in the $1.10 - $1.15 area of support and near the chart's daily support line. Furthermore, the higher time frame indicators are oversold, so there is a chance THETA tests the next resistance at $1.30, followed by the big resistance area between $1.60 - $1.70.
That thesis is US stock market and bitcoin dependent, but I will continue using the current support area as a trade entry zone.
If THETA loses its current support area and breaches the daily support trend line, the next area of support is around $1.00. THETA has been in an 18-month decline, so I feel there is potential for a lot more upside in the following months.
Check our Crypto Banter Discord here for updates!
Follow me on Twitter to get all the updates on my personal trading progress!
Claim your Bitget sign-up bonuses here (details below).
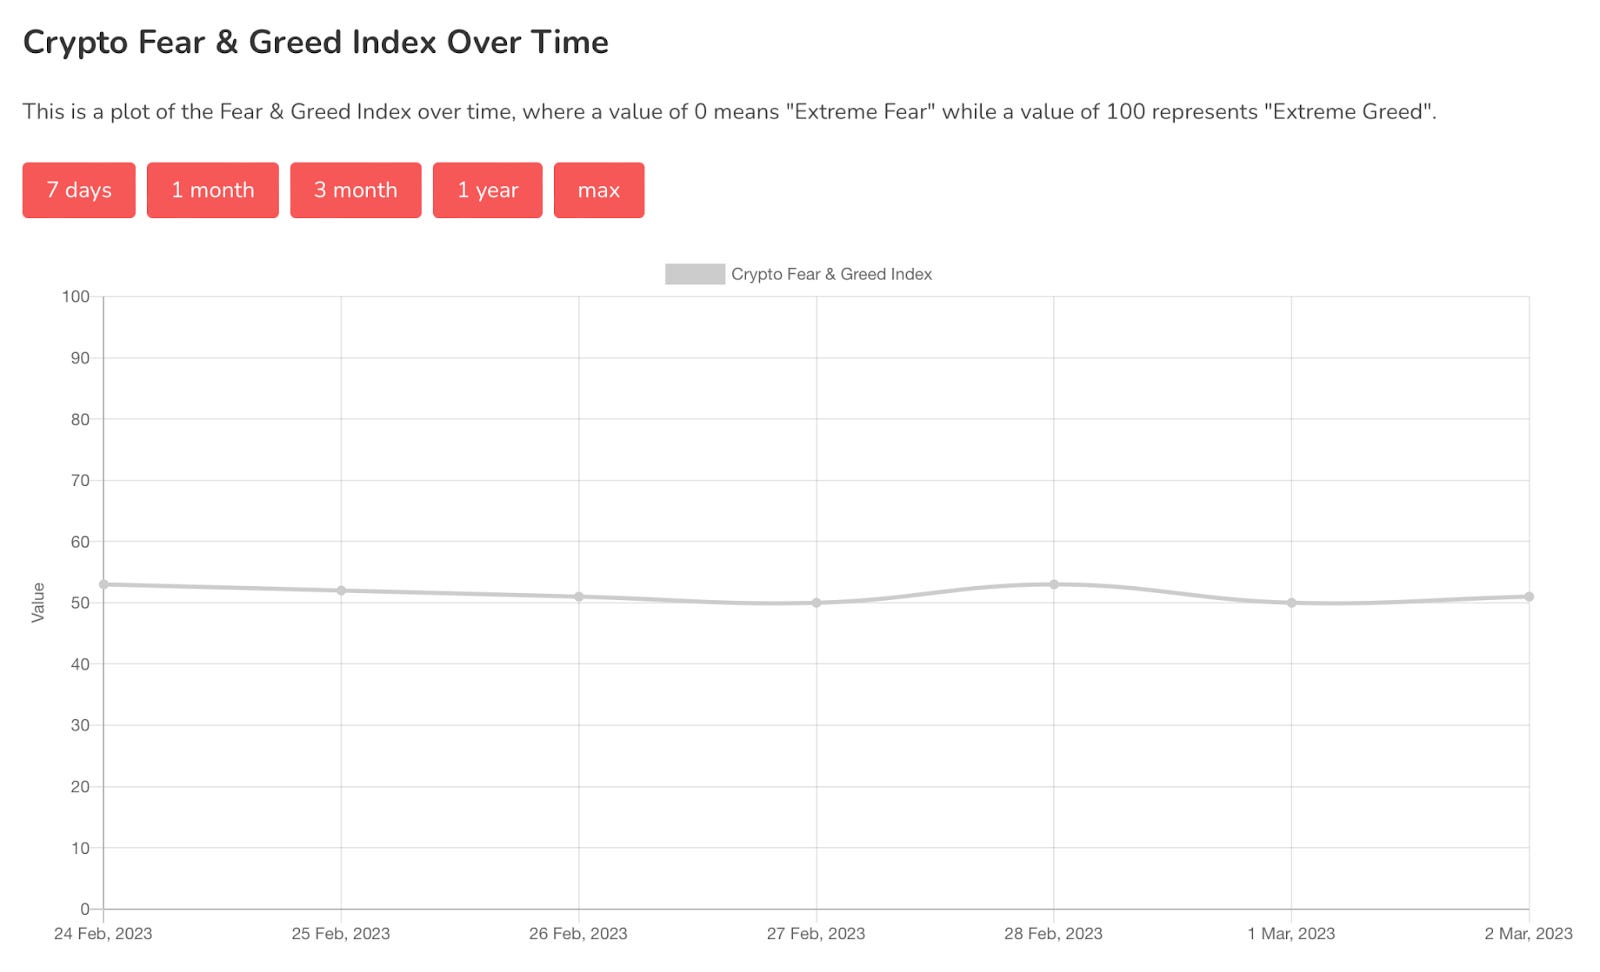
Chart #5 - Bitcoin Fear and Greed Index
The Bitcoin Fear and Greed Index is sitting at 51 today, Neutral.
The highest the index has been over the past seven days is 53, and the lowest is 50.
Overall Market Sentiment (Banter’s Take)
The market sentiment has become incredibly bearish with fears of increasing inflation, Mount Gox bitcoin hitting the market, and a massive amount of ETH being unstaked after the Ethereum Shanghai upgrade.
That means market participants are either sidelined in cash or short.
Chart-wise, so long as bitcoin doesn't break structure to the downside, the play would be to look for longs on the leading crypto.
Stay safe my friends!
Bybit winner - 26127153