

📈📉 ATOM and TRIAS Presenting Buy Opportunities!
📈📉 ATOM and TRIAS Presenting Buy Opportunities!

Overview
Chart #1 - Cardano (ADAUSDT) 8-Hour Chart
Chart #2 - TriasLab (TRIASUSDT) Daily Chart
Chart #3 - Cosmos (ATOMUSDT) Daily Chart
Chart #4 - Polygon (MATICUSDT) 8-Hour Chart
Chart #5 - Fear and Greed Index

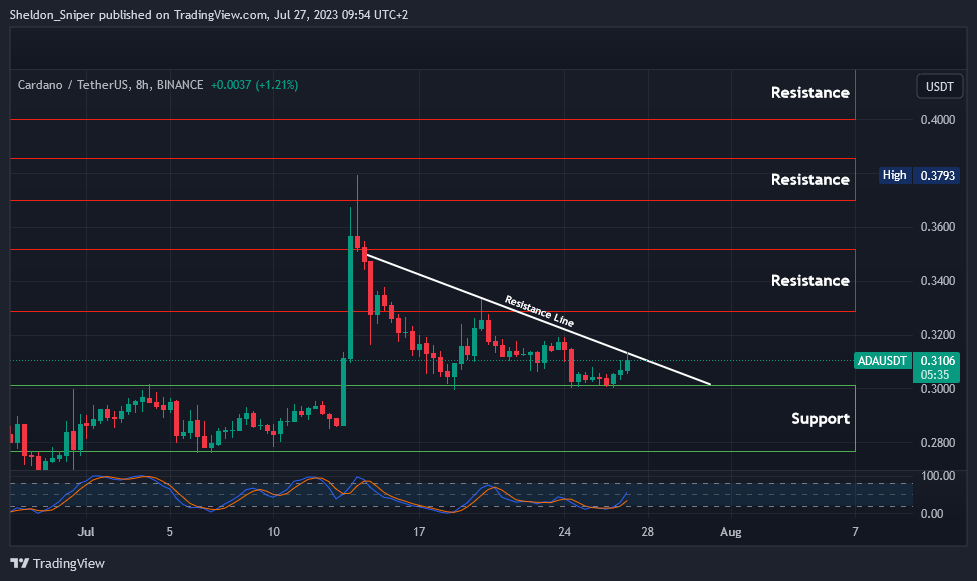
Chart #1 - Cardano (ADAUSDT) 8-Hour Chart
Chartist: Sheldon
(For the chart screenshot, click here.)
After yesterday's FOMC meeting, the market has started to show signs of moving up. However, caution is still necessary for the next two days due to more economic news coming.
Overnight, ADA has moved off the $0.30 level of support and is currently trading around $0.31. It is also now at the descending resistance line originating from mid-July. If it can break through this line, it will head to $0.33 - $0.35. The resistance area after that is at $0.37 - $0.38. If the market becomes bearish and the current support is lost, the next support area is at the range low of $0.28.
As for BTC Dominance, it could still have further to fall. It's uncertain when this will happen, but a decrease in BTC.D will be very bullish for the alts.
Sign-up and trade on Bybit today.
Exclusive $30,000 deposit rewards and bonuses up for grabs!
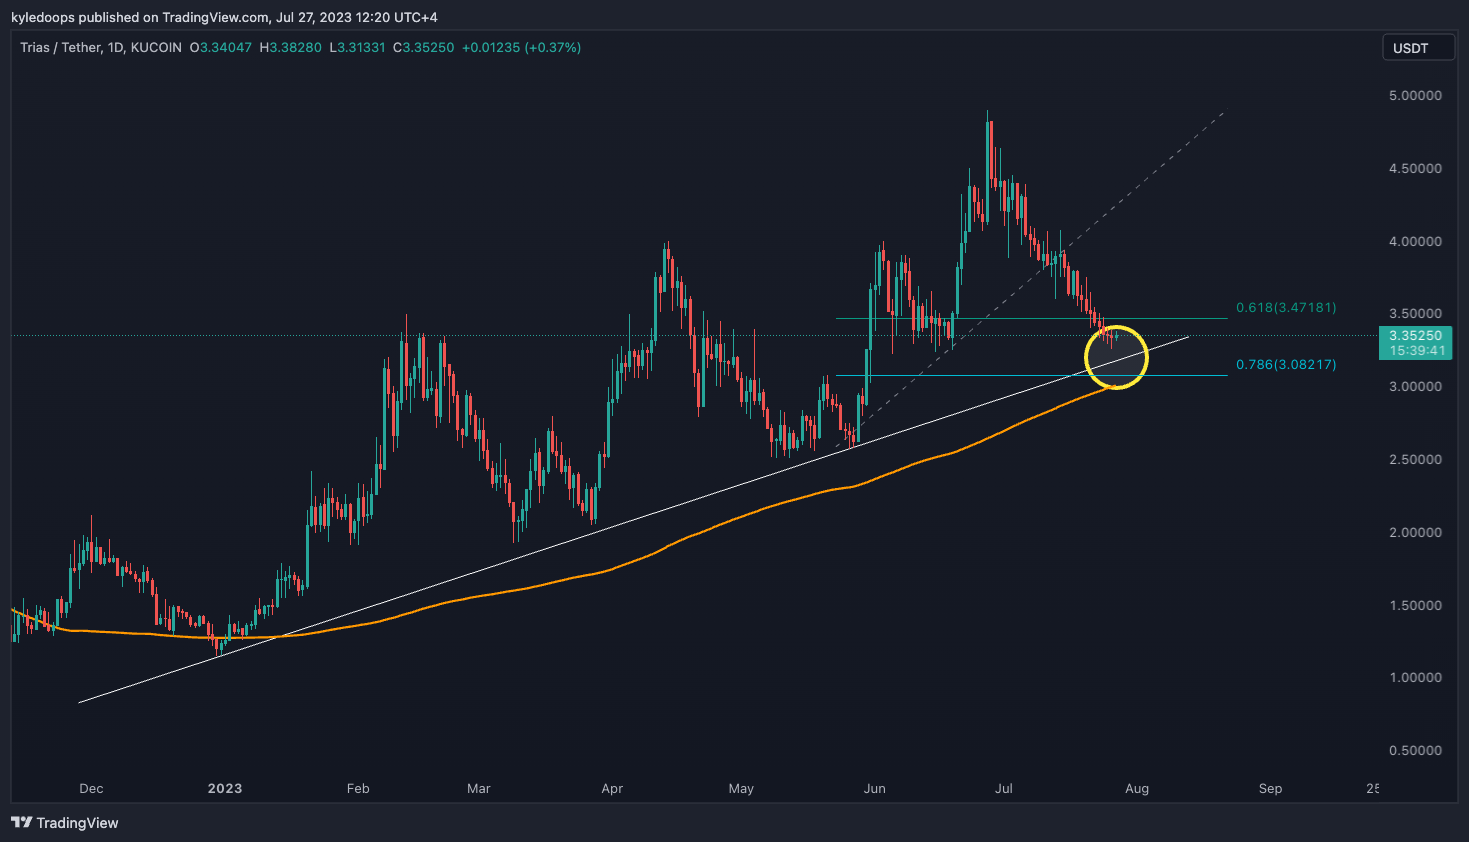
Chart #2 - TriasLab (TRIASUSDT) Daily Chart
Chartist: Kyle
(For the chart screenshot, click here.)
TRIAS is among the select few coins that have been in an uptrend against Bitcoin this year.
It's currently entering a zone that presents a potential buy the dip scenario. This scenario involves a higher low, the confluence of a diagonal trend line, 200-day MA support, and a pocket between the 0.618 and the 0.786.
If the price starts showing signs of strength within that pocket, it would be a great buy signal.
𝗣𝗿𝗶𝗺𝗲 𝗫𝗕𝗧
Sign up for a new Trading Account on Prime XBT!
Receive a deposit bonus of up to $7,000 with promo code: KyleDoops

Sign up for a new Trading Account on Prime XBT!
Receive a deposit bonus of up to $7,000 with promo code: SheldonSniper
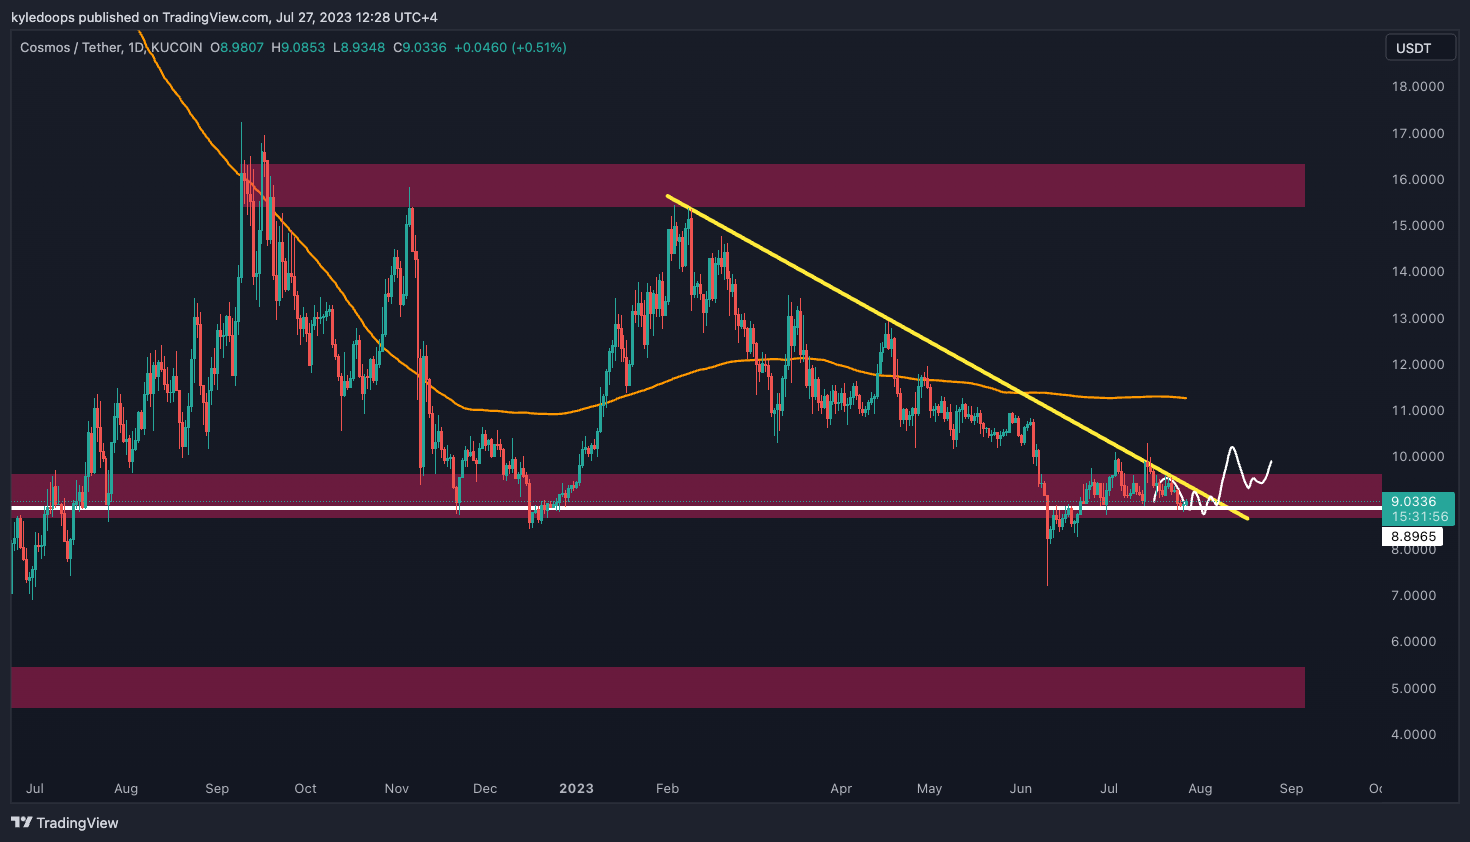
Chart #3 - Cosmos (ATOMUSDT) Daily Chart
Chartist: Kyle
(For the chart screenshot, click here.)
It's worth keeping ATOM on our watchlist in the event that the price breaks above the yellow downward-sloping trend line.
In such a case, momentum may return to the market, and our next target would be the 200-day moving average at $11.20.
It's crucial to wait for closing candles above the downward-sloping trend line first, as this would confirm the break above.
Claim your Bitget sign-up bonuses here (details below).
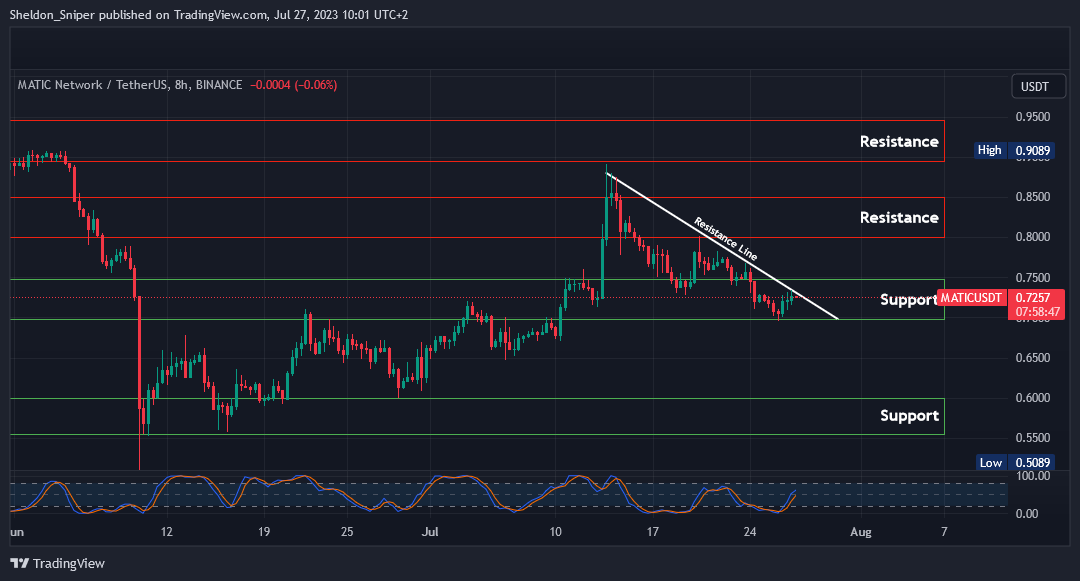
Chart #4 - Polygon (MATICUSDT) 8-Hour Chart
Chartist: Sheldon
(For the chart screenshot, click here.)
Following yesterday’s FOMC, MATIC moved off the $0.70 level of support. It is currently trading at $0.725 and has reached a resistance line that dates back to mid-July.
If the price can break the current resistance line, the next hurdle is the $0.75 level.
If the market turns bearish and the $0.70 support level is lost, the next level of support is at $0.65, with a major support area below that at $0.55 - $0.60.
Claim your Bitget sign-up bonuses here (details below).
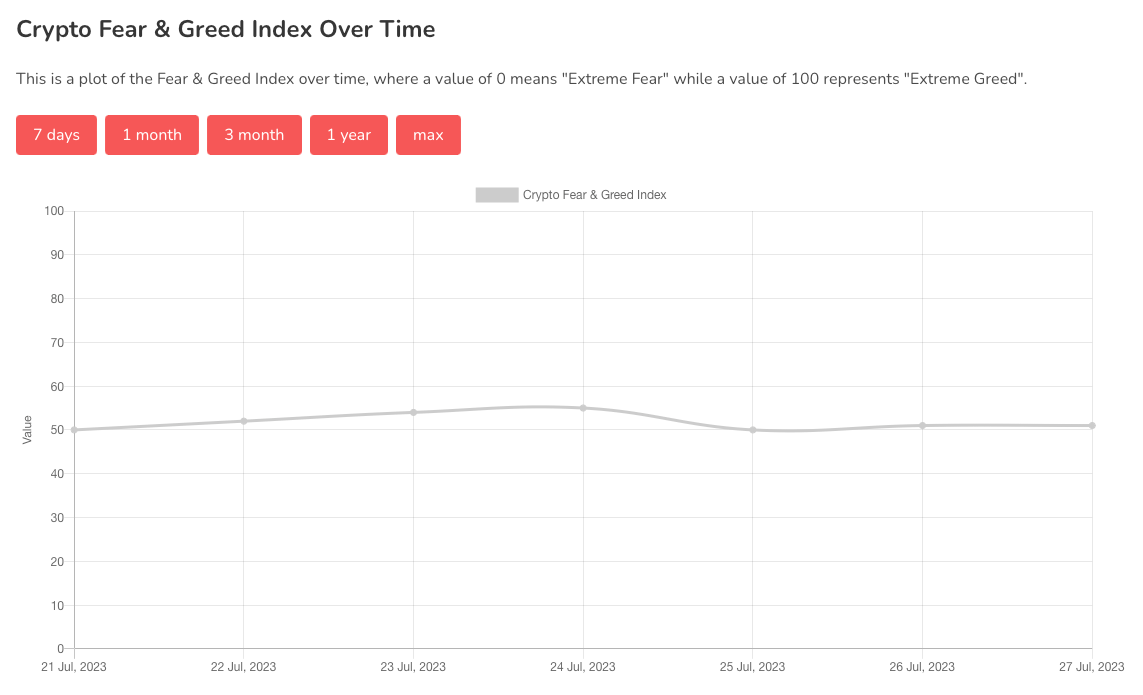
Chart #5 - Fear and Greed Index
The Fear and Greed Index is sitting at 51 today, Neutral.
The highest the index has been over the past seven days is 55, and the lowest is 50.
Banter’s Take
The market is likely to continue its rebound into its former range now that the FOMC data is out and the 25bps rate hike is out of the way.
Bitcoin continues to demonstrate decoupling from the stock market; while the S&P 500 is nearing an all-time-high, Bitcoin is nowhere near its highs.
Stay safe my friends!
Go to our Crypto Banter Discord here where Sheldon and Kyle give updates on the charts and trades from The Daily Candle newsletter!