

📈📉 ATTENTION: MAJOR Bitcoin BREAKOUT in Play!
📈📉 ATTENTION: MAJOR Bitcoin BREAKOUT in Play!
Bitcoin Could be Heading to $42k!
Overview
Chart #1 - Crypto Total Market Cap (TOTAL) Daily
Chart #2 - Bitcoin (BTCUSD) Daily
Chart #3 - Bitcoin Dominance (BTC.D) Weekly
Chart #4 - Polkadot (DOTUSDT) Daily
Chart #5 - Fear and Greed Index
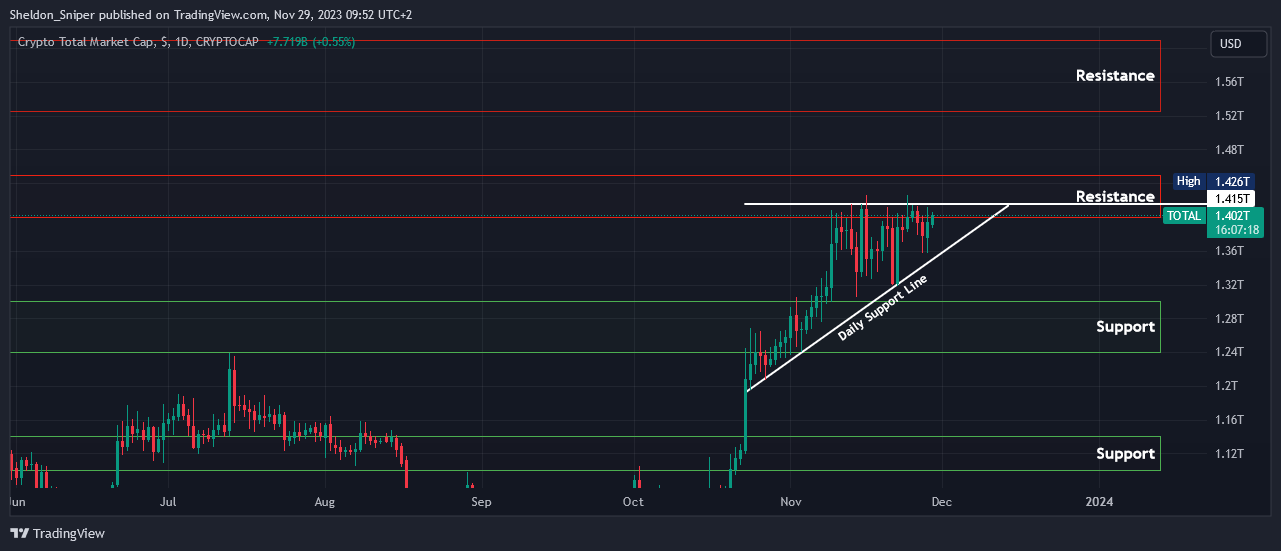
Chart #1 - Crypto Total Market Cap (TOTAL) Daily
Chartist: Sheldon
(For the chart screenshot, click here.)
Over the last five weeks, the Total Market Cap has been in a rising wedge, and is now getting very close to the end of it.
In the coming week, I expect either a break to the upside through resistance or to the downside through the daily support line.
If it can break through the $1.415T - $1.43T area of resistance, it should head to $1.52T - $1.60T. And a fall will lead it to $1.24T - $1.30T.
Sign-up and trade on Bybit today.
Exclusive $30,000 deposit rewards and bonuses up for grabs!
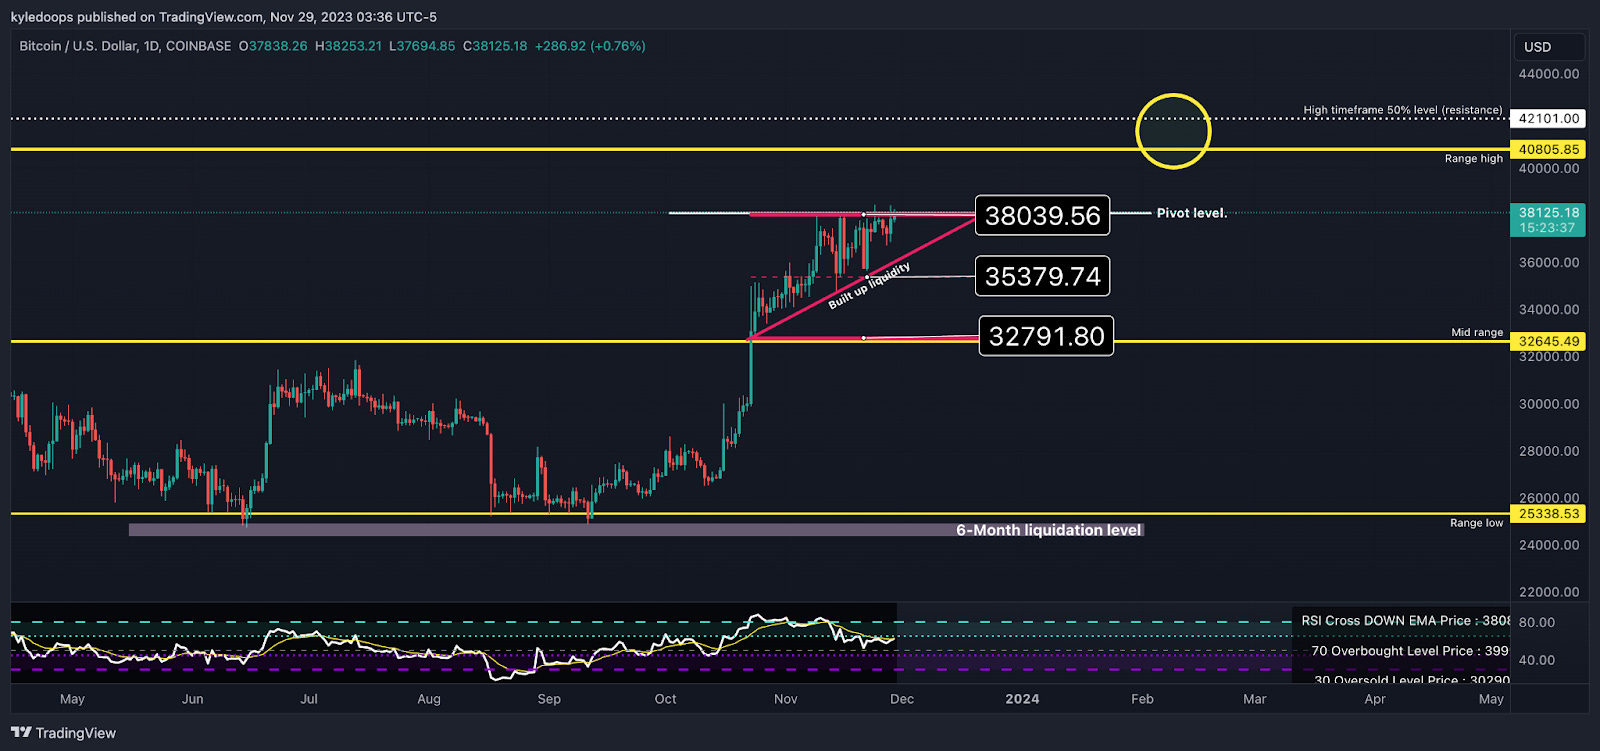
Chart #2 - Bitcoin (BTCUSD) Daily
Chartist: Kyle
(For the chart screenshot, click here.)
Bitcoin is attempting to reclaim the pivot level at $38,131.
If it can get above that level today, then the RSI will trend back up and that could confirm a major breakout is in play.
The next major target is the yellow-circled area between $40,805 - $42,101.
That would be a profit-taking level for us.
Claim your Bitget sign-up bonuses here (details below).

Outsmart 99% Of The Market!
Get full access into our Discord And Telegram group, where you'll find all of our premium content!
👉 Trade Signals!
👉 Trade Set-Ups!
👉 Trading Challenges!
👉 Education!
👉 SO MUCH MORE!
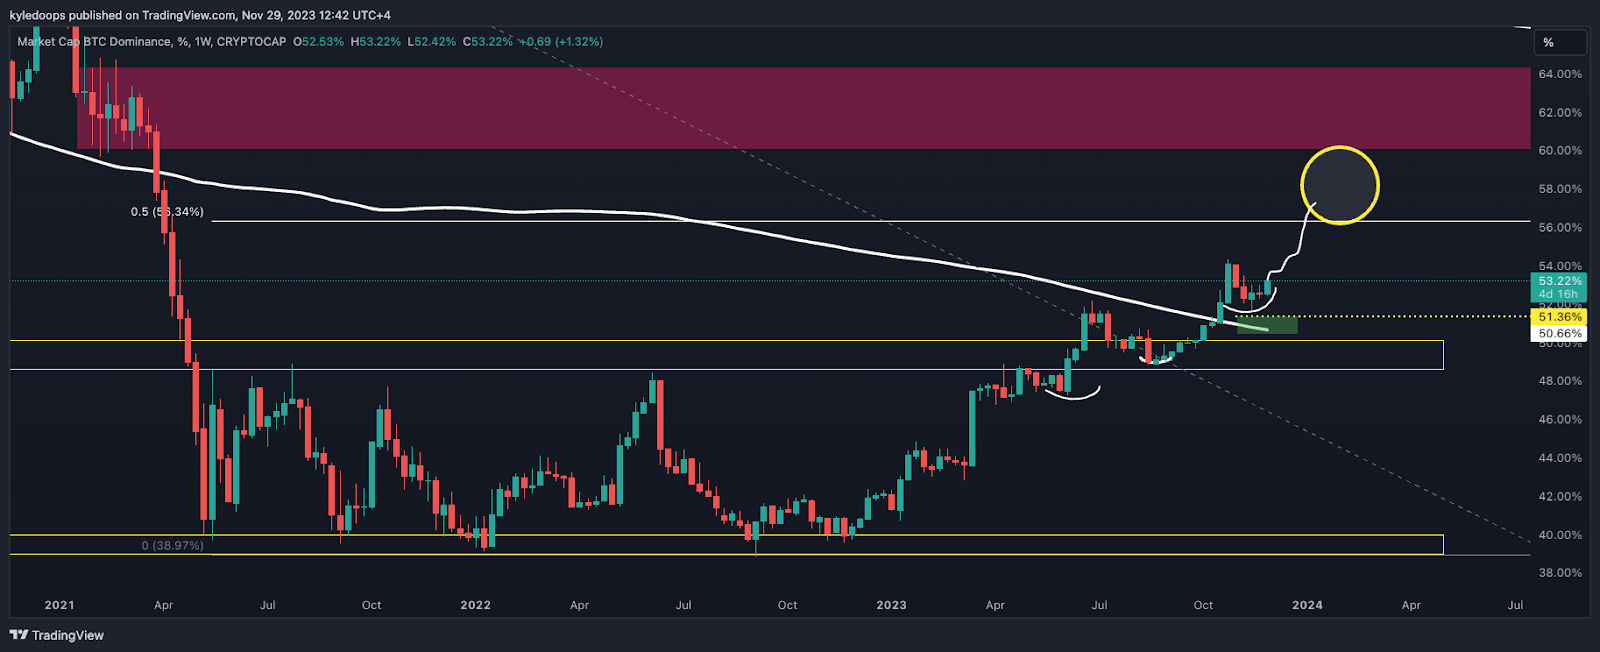
Chart #3 - Bitcoin Dominance (BTC.D) Weekly
Chartist: Kyle
(For the chart screenshot, click here.)
Bitcoin dominance is now setting the next higher low and pushing up towards the 55-60% range.
This follows a major range breakout from months ago.
The invalidation on the longs is now at 51.36%.
This supports the notion that Bitcoin is likely to get that push up.
Claim your Bitget sign-up bonuses here (details below).
Chart #4 - Polkadot (DOTUSDT) Daily
Chartist: Sheldon

(For the chart screenshot, click here.)
DOT is trading in the $4.90 - $5.25 area of support, near the daily support line.
The market is looking bullish, and DOT is still oversold.
Put two and two together and we could see DOT pump to $5.80 - $6.20 soon.
Claim your Bitget sign-up bonuses here (details below).
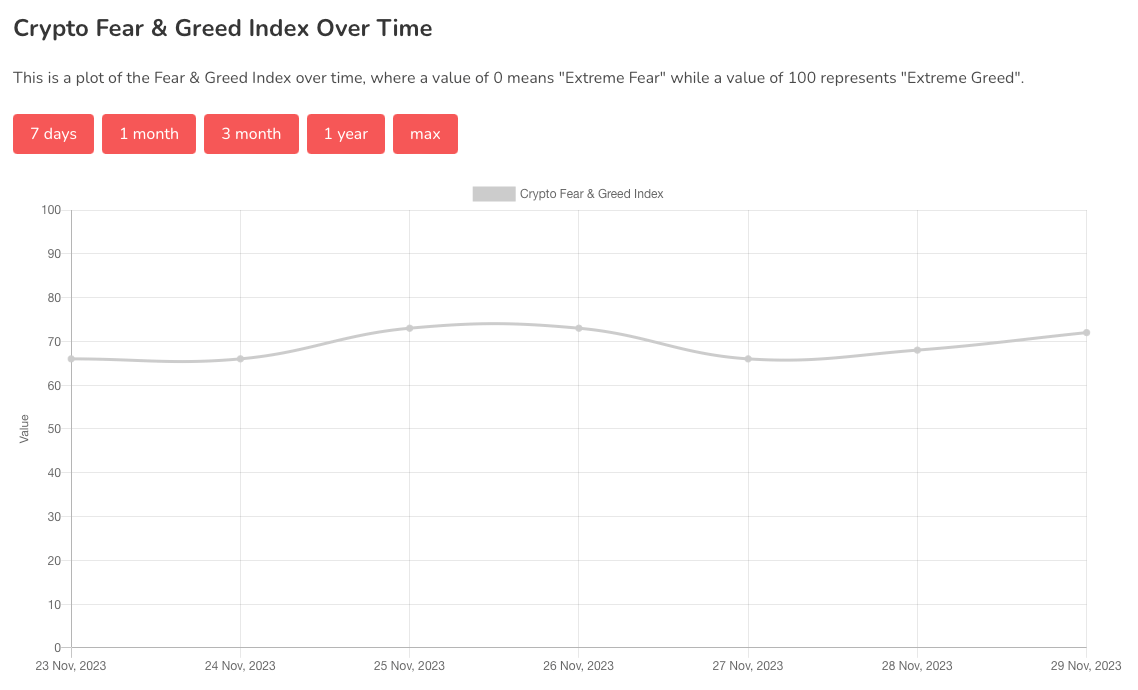
Chart #5 - Fear and Greed Index
The Fear and Greed Index is sitting at 72 today, indicating Greed.
The highest the index has been over the past seven days is 73, and the lowest is 66.
Banter’s Take
The market appears primed for a final push up!
However, this next surge is likely a critical point for considering profit-taking, as all markets will be approaching a key resistance level. Additionally, Bitcoin is on the verge of surpassing the major psychological threshold of $40,000.
Stay safe my friends!
Go to our Crypto Banter Discord here where Sheldon and Kyle give updates on the charts and trades from The Daily Candle newsletter!