

📈📉 ATTENTION: Time to Convert Our BTC into ETH!
📈📉 ATTENTION: Time to Convert Our BTC into ETH!
PLUS: Is the S&P 500 Forming a Head and Shoulders?
Overview
Chart #1 - U.S. Dollar (DXY) Daily
Chart #2 - S&P 500 Futures (ES1!) Daily
Chart #3 - Ethereum to Bitcoin Ratio (ETHBTC) Daily
Chart #4 - Ethereum (ETHUSDT) Daily
Chart #5 - Fear and Greed Index
Chart #1 - U.S. Dollar (DXY) Daily
Chartist: Sheldon
(For the chart screenshot, click here.)
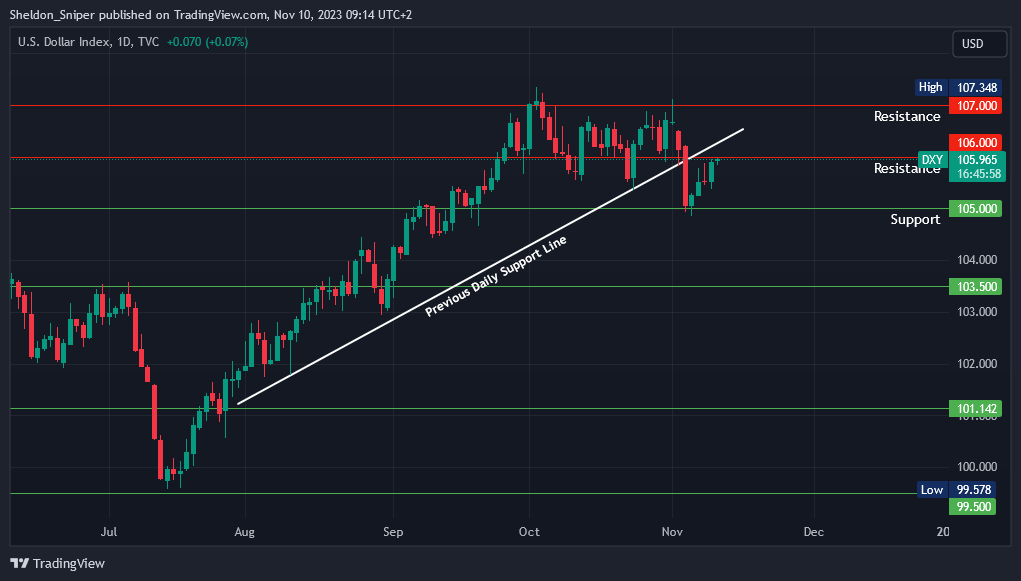
The DXY has reached both the 106.00 – 106.50 resistance area and the previous daily support line originating from August.
This support line was breached downward at the start of November, and it appears that the price is now approaching to potentially retest that line, which is now acting as resistance.
If the DXY is rejected in this area and retraces from here, it would be very bullish for the markets as cash flows out of the safety of the US Dollar and into risk-on assets.
The next support levels are at 105.00 and then at 103.50.
Sign-up and trade on Bybit today.
Exclusive $30,000 deposit rewards and bonuses up for grabs!
Chart #2 - S&P 500 Futures (ES1!) Daily
Chartist: Kyle
(For the chart screenshot, click here.)
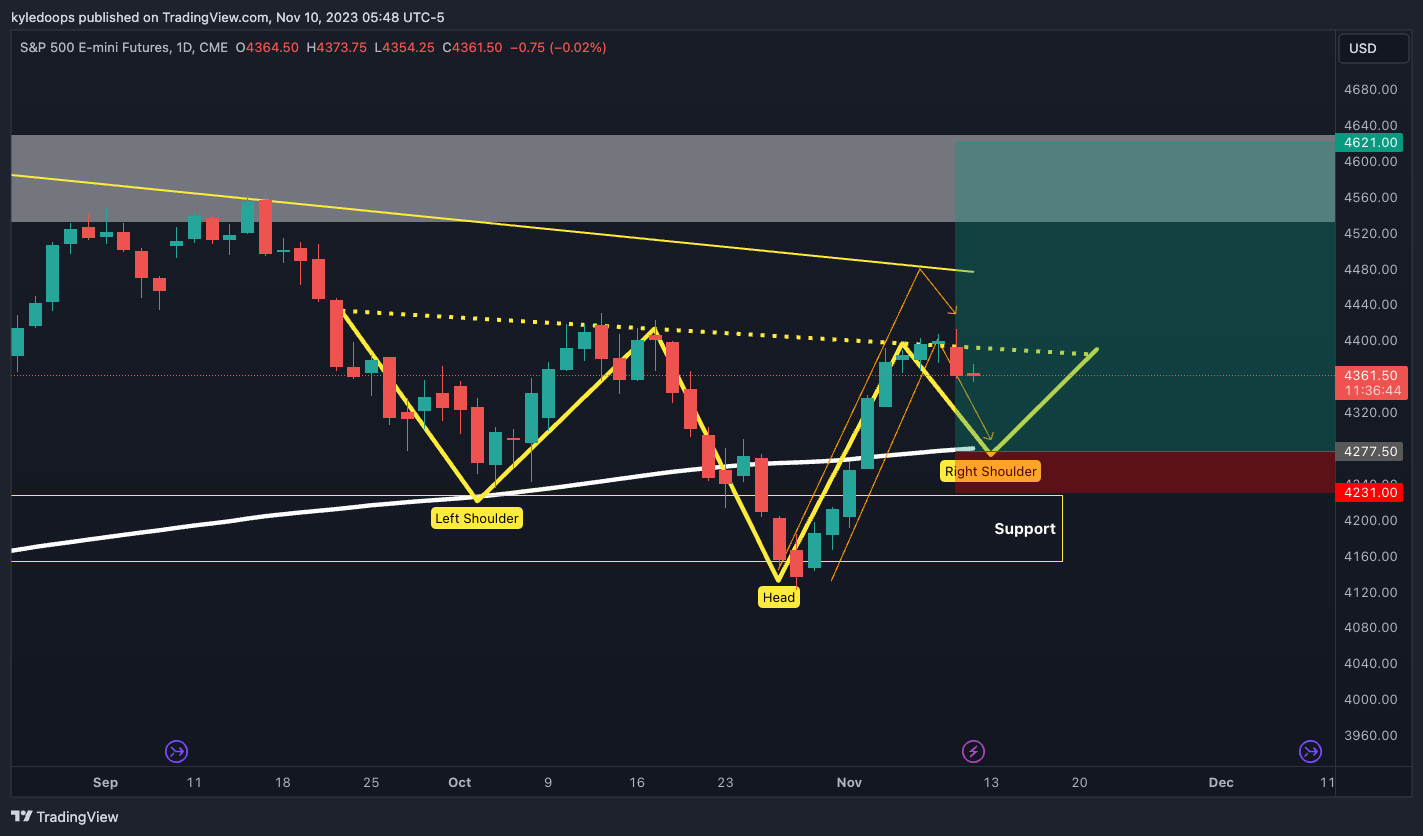
The S&P 500 is approaching a critical level once again!
Watch for the potential head and shoulders pattern playing out. This is where I would look to form a long trade, if it comes into that 200 day MA, whilst forming the right shoulder or higher low.
Once the bullish candles print, I’ll put my stop below and trade it up to the resistance at 4,621.
Claim your Bitget sign-up bonuses here (details below).

Outsmart 99% Of The Market!
Get full access into our Discord And Telegram group, where you'll find all of our premium content!
👉 Trade Signals!
👉 Trade Set-Ups!
👉 Trading Challenges!
👉 Education!
👉 SO MUCH MORE!
Chart #3 - Ethereum to Bitcoin Ratio (ETHBTC) Daily
Chartist: Kyle
(For the chart screenshot, click here.)
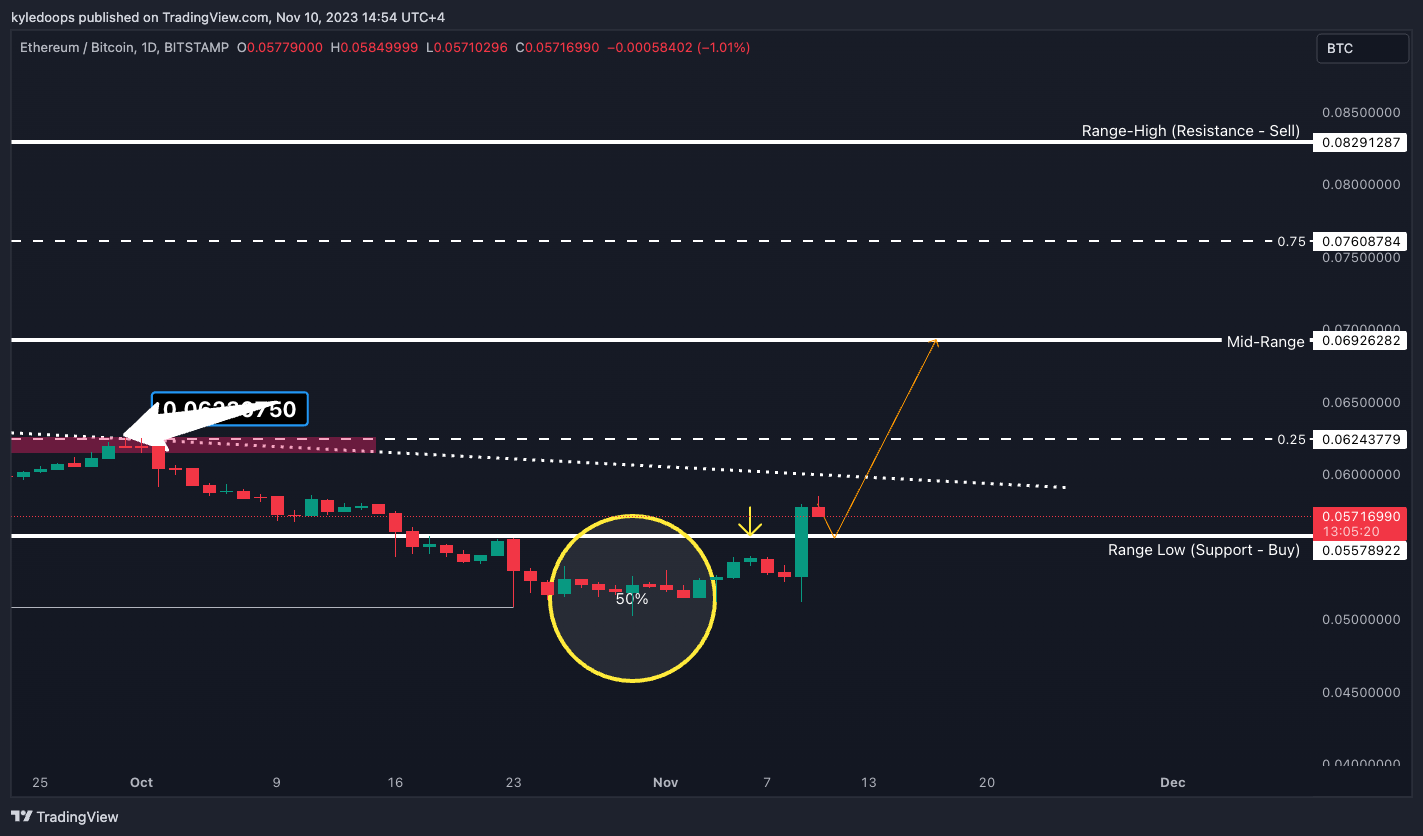
ETH/BTC has reclaimed the range low. This is something massive which we need to pay attention to!
Typically when this occurs the back test into that level is brought up and one can expect continuation higher. Right now this looks to be the case, following yesterday’s super strong daily candle close.
Therefore now may be a good time to convert some BTC into ETH.
Claim your Bitget sign-up bonuses here (details below).
Chart #4 - Ethereum (ETHUSDT) Daily
Chartist: Sheldon
(For the chart screenshot, click here.)
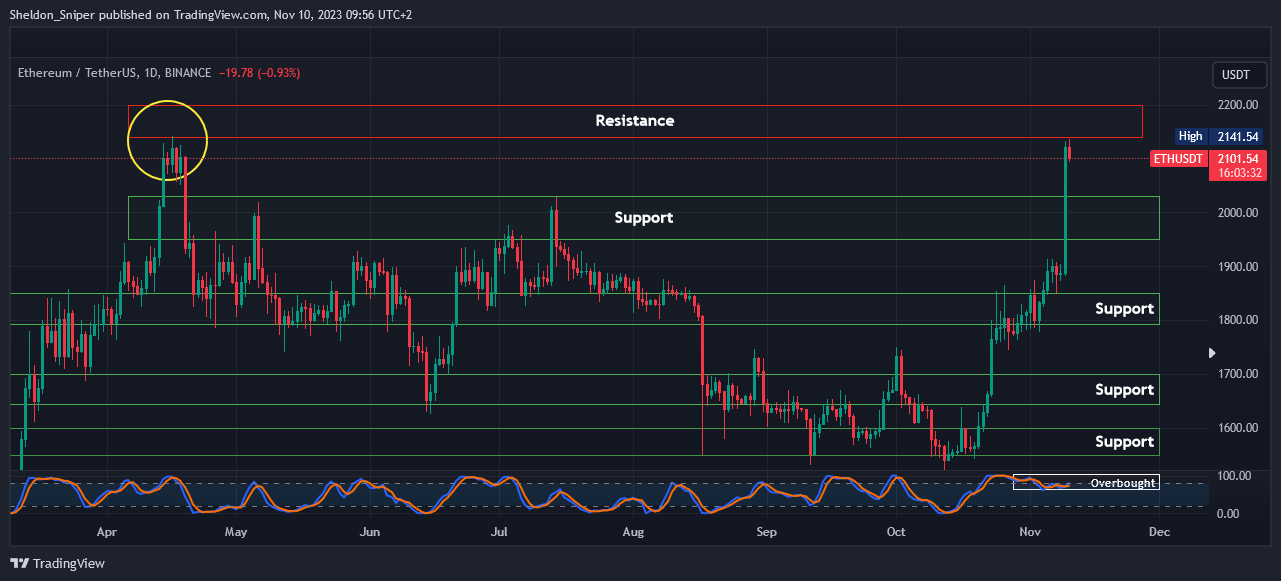
I anticipate ETH may consolidate for some time between the $2,030 support and the $2,140 resistance.
However, there is potential for a breakthrough beyond the $2,140 - $2,200 resistance area, up to $2,300 - $2,500. While the price is overbought on the daily timeframe, it can remain so for an extended period.
If $2,030 is breached, the next big support is at the lower range boundary of $1,950.
Claim your Bitget sign-up bonuses here (details below).
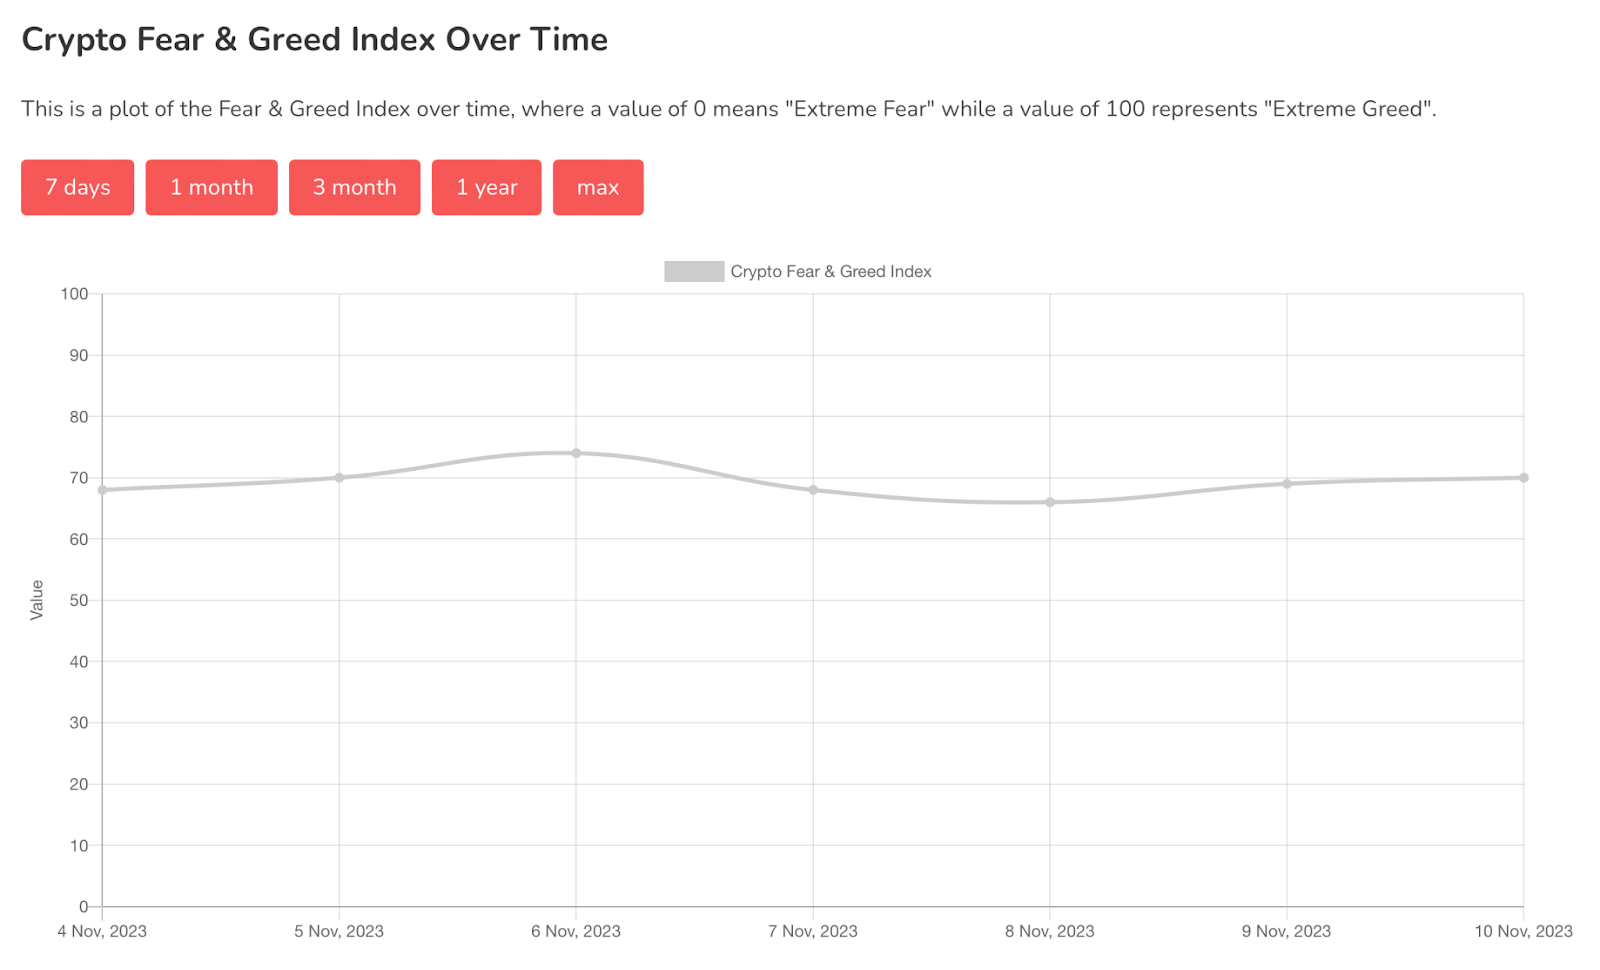
Chart #5 - Fear and Greed Index
The Fear and Greed Index is sitting at 70 today, indicating Greed.
The highest the index has been over the past seven days is 74, and the lowest is 66.
Banter’s Take
With the recent news of BlackRock filing for an ETH spot ETF, ETH has experienced an aggressive rally and is likely to continue its upward trajectory.
It is currently in a significant ascending triangle pattern, so higher prices may print in the coming weeks. And, it is likely that altcoins will follow this upward trend.
Stay safe my friends!
Go to our Crypto Banter Discord here where Sheldon and Kyle give updates on the charts and trades from The Daily Candle newsletter!