

📈📉 Bears Will PUSH Bitcoin to $23,500!
📈📉 Bears Will PUSH Bitcoin to $23,500!
Unless Bulls Defend THIS Level!
Overview
Chart #1 - Bitcoin Dominance (BTC.D) Daily
Chart #2 - Bitcoin (BTCUSD) Weekly
Chart #3 - Ethereum to Bitcoin Ratio (ETHBTC) Daily
Chart #4 - Ethereum (ETHUSDT) Daily
Chart #5 - Fear and Greed Index

Chart #1 - Bitcoin Dominance (BTC.D) Daily Chart
Chartist: Sheldon
(For the chart screenshot, click here.)
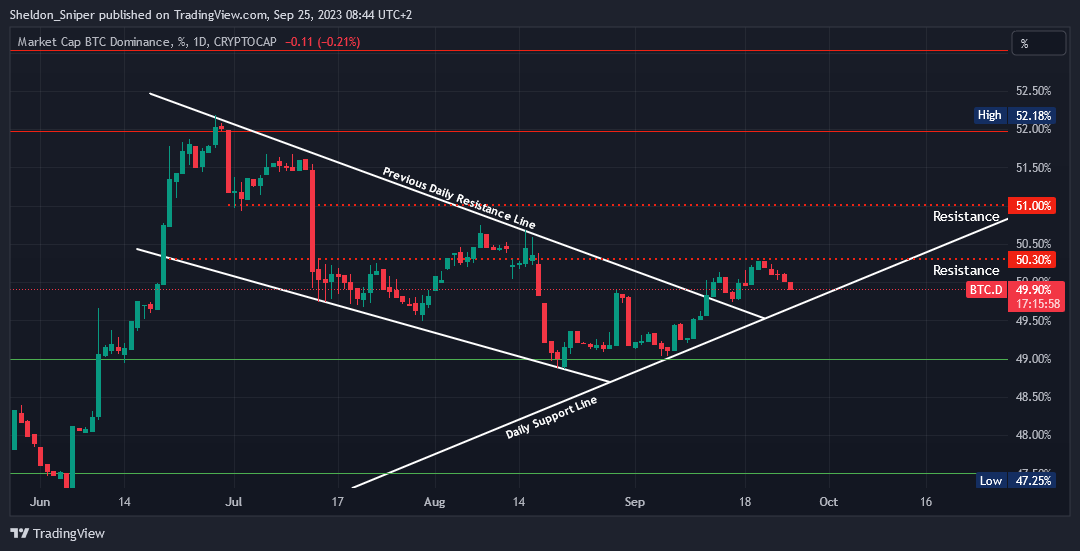
Last week Bitcoin Dominance got rejected at the 50.3% level, and has started to retrace to where it is currently at 49.90%.
The Total Crypto Market Cap (TOTAL) has also retraced.
The next level of support to watch is the ascending support line, around 49.50%.
Sign-up and trade on Bybit today.
Exclusive $30,000 deposit rewards and bonuses up for grabs!
Chart #2 - Bitcoin (BTCUSD) Weekly Chart
Chartist: Kyle
(For the chart screenshot, click here.)
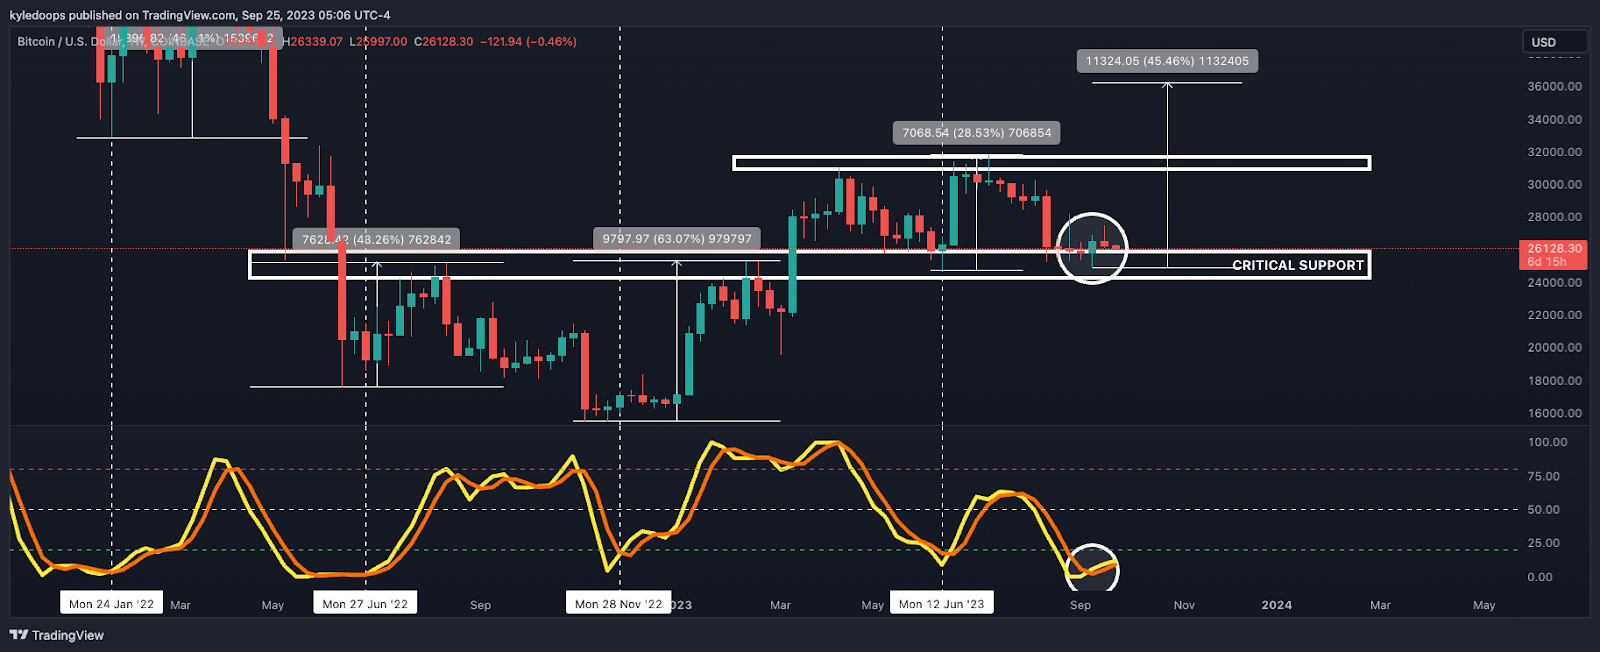
Bitcoin continues to maintain a robust level of support, and momentum oscillators, as reflected by the stochastic RSI, are still angled upward.
Bulls are eager to reclaim the $28,100 mark, which would significantly bolster momentum to the upside.
But, bears aim to push the price below $25,000, a move that could rapidly steer the price towards the $23,500 target.
Claim your Bitget sign-up bonuses here (details below).
Chart #3 - Ethereum to Bitcoin Ratio (ETHBTC) Daily Chart
Chartist: Kyle
(For the chart screenshot, click here.)
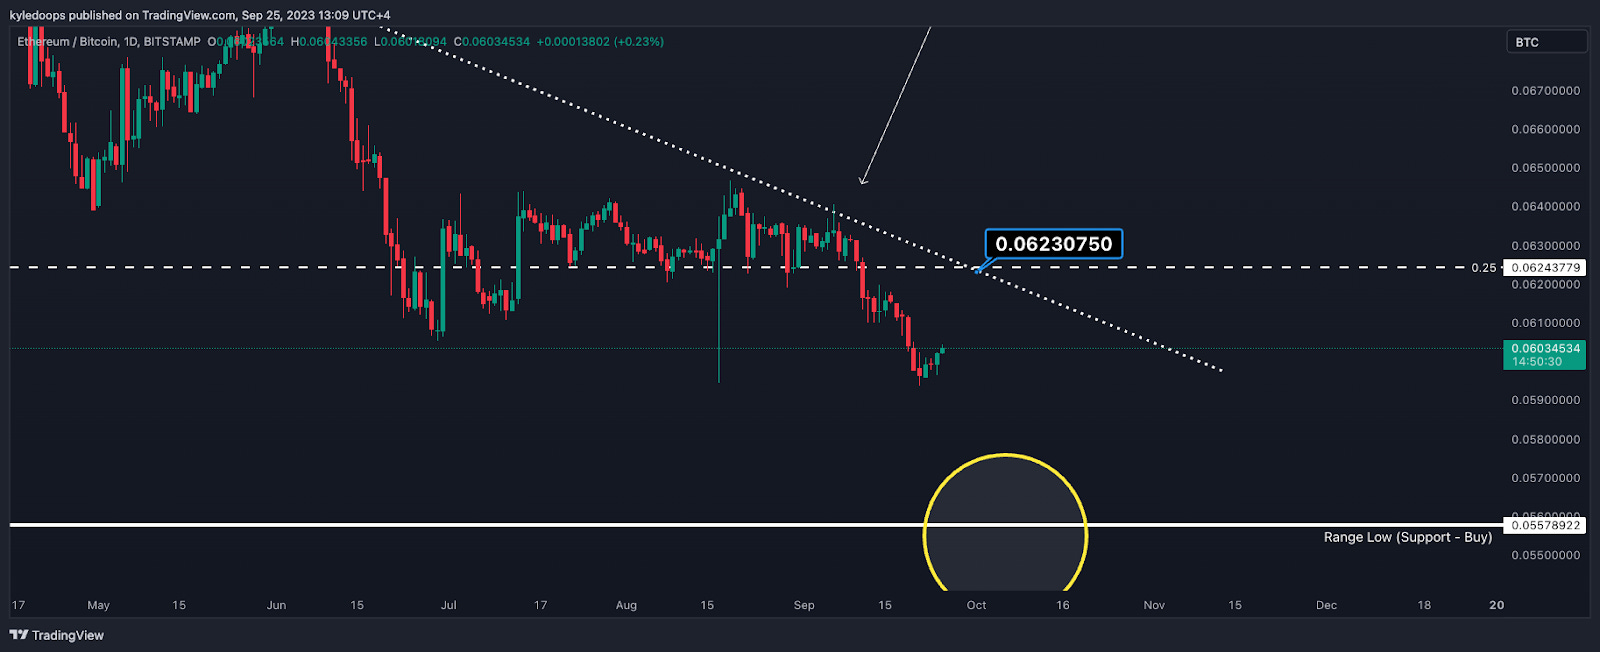
ETH remains in a high-timeframe range-bound environment, with a low-timeframe downtrend, gradually approaching the range's lower support.
It's currently experiencing a bounce, but is likely to encounter underside resistance at 0.062, as indicated by the price label.
This point would be an opportune moment to convert ETH profits into BTC, as a rejection is probable here, leading to a continuation toward the ultimate range low in the medium timeframe.
Claim your Bitget sign-up bonuses here (details below).
Chart #4 - Ethereum (ETHUSDT) Daily Chart
Chartist: Sheldon
(For the chart screenshot, click here.)
Bitcoin Dominance is retracing, possibly only descending to the next level of support.
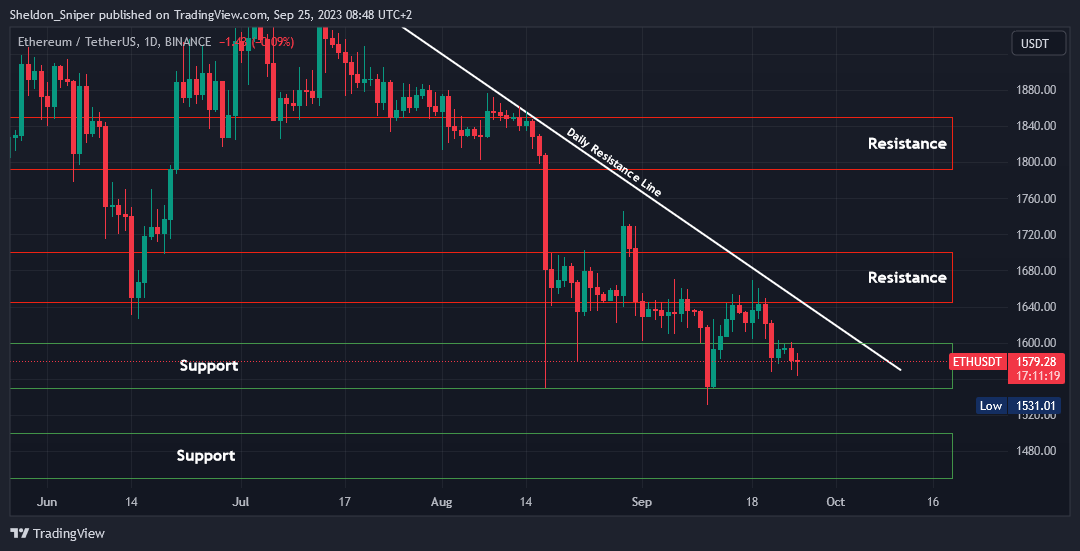
I am currently eyeing a potential move in Ethereum to challenge the upcoming resistance levels. The price is presently trading at $1,580 and has been consolidating within the $1,550 - $1,600 support zone for the past few days.
If the price can surpass the $1,600 mark, there's a potential for it to test the next resistance at $1,650 - $1,700.
Claim your Bitget sign-up bonuses here (details below).
Chart #5 - Fear and Greed Index
The Fear and Greed Index is sitting at 47 today, Neutral.
The highest the index has been over the past seven days is 47, and the lowest is 43.

Banter’s Take
Bitcoin is presently in a corrective phase, but the price is likely to find support at $25,500. If it doesn't, and it closes a daily below $25,000, then bears will regain full control.
Be wary of that level, as it represents the pivotal point of control. The crypto market remains tethered to the stock market, especially as stocks retract.
Stay safe my friends!
Go to our Crypto Banter Discord here where Sheldon and Kyle give updates on the charts and trades from The Daily Candle newsletter!