

📈📉 Big BTC Move Coming? We Shifted Out of ETH!
📈📉 Big BTC Move Coming? We Shifted Out of ETH!

Chart #1 - Aave (AAVEUSDT) 1-Day Chart
Chartist: Sheldon

(For the chart screenshot, click here.)
This past Sunday, AAVE experienced a substantial price surge to the upside. Not only did the price rally by 35% in one day, but it also broke through the two-month daily downtrend resistance line.
The price skyrocketed from $57 to $77 within the day before hitting resistance and has since been retracing, seemingly to retest the previous trend line.
The price is currently trading at $61, and the retest will most likely take place between $56 - $60. This zone could potentially provide an entry point for a long trade if the price can maintain the resistance-turned-support trend line.
The following resistance area or target will be between $62 - $66.
Sign-up and trade on Bybit today.
Exclusive $30,000 deposit rewards and bonuses up for grabs!
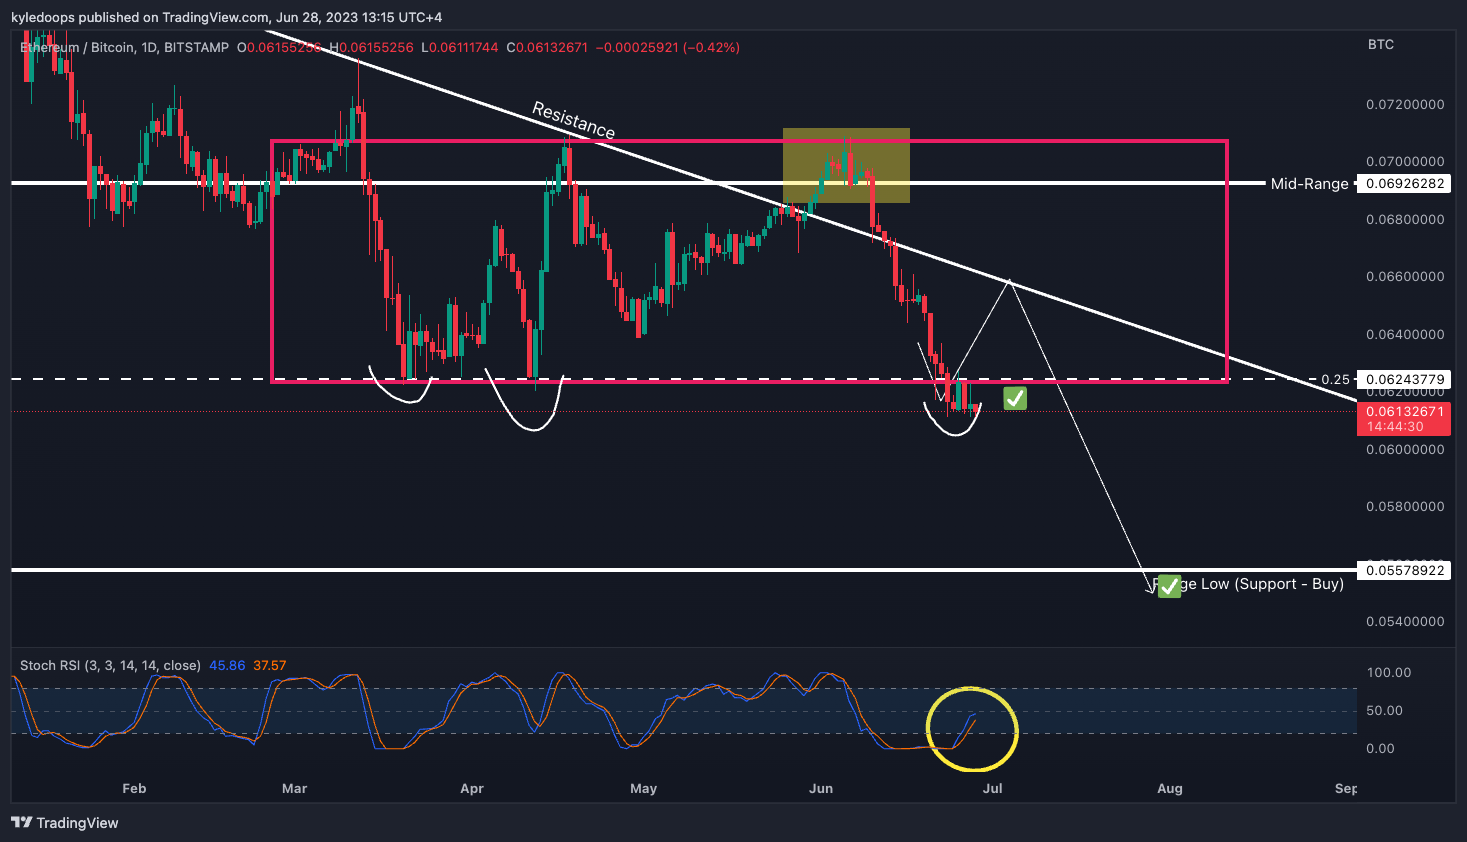
Chart #2 - Ethereum to Bitcoin Ratio (ETHBTC) 1-Day Chart
Chartist: Kyle
(For the chart screenshot, click here.)
Originally, we anticipated a bounce back on the ETH/BTC pair, but given the delayed bounce, we've decided to shift ETH positions back into BTC for the time being.
This decision is due to the trade idea nearing invalidation as ETH/BTC is increasingly settling below the 0.062 level, and failing to regain its footing within the range. This could be interpreted as a bear flag in the making.
The ultimate target is 0.0557.
It's essential to clarify that ETH/BTC could still rise in accordance with the original plan. However, the longer it stagnates here, the greater the risk becomes.
𝗣𝗿𝗶𝗺𝗲 𝗫𝗕𝗧
Sign up for a new Trading Account on Prime XBT!
Receive a deposit bonus of up to $7,000 with promo code: KyleDoops

Sign up for a new Trading Account on Prime XBT!
Receive a deposit bonus of up to $7,000 with promo code: SheldonSniper
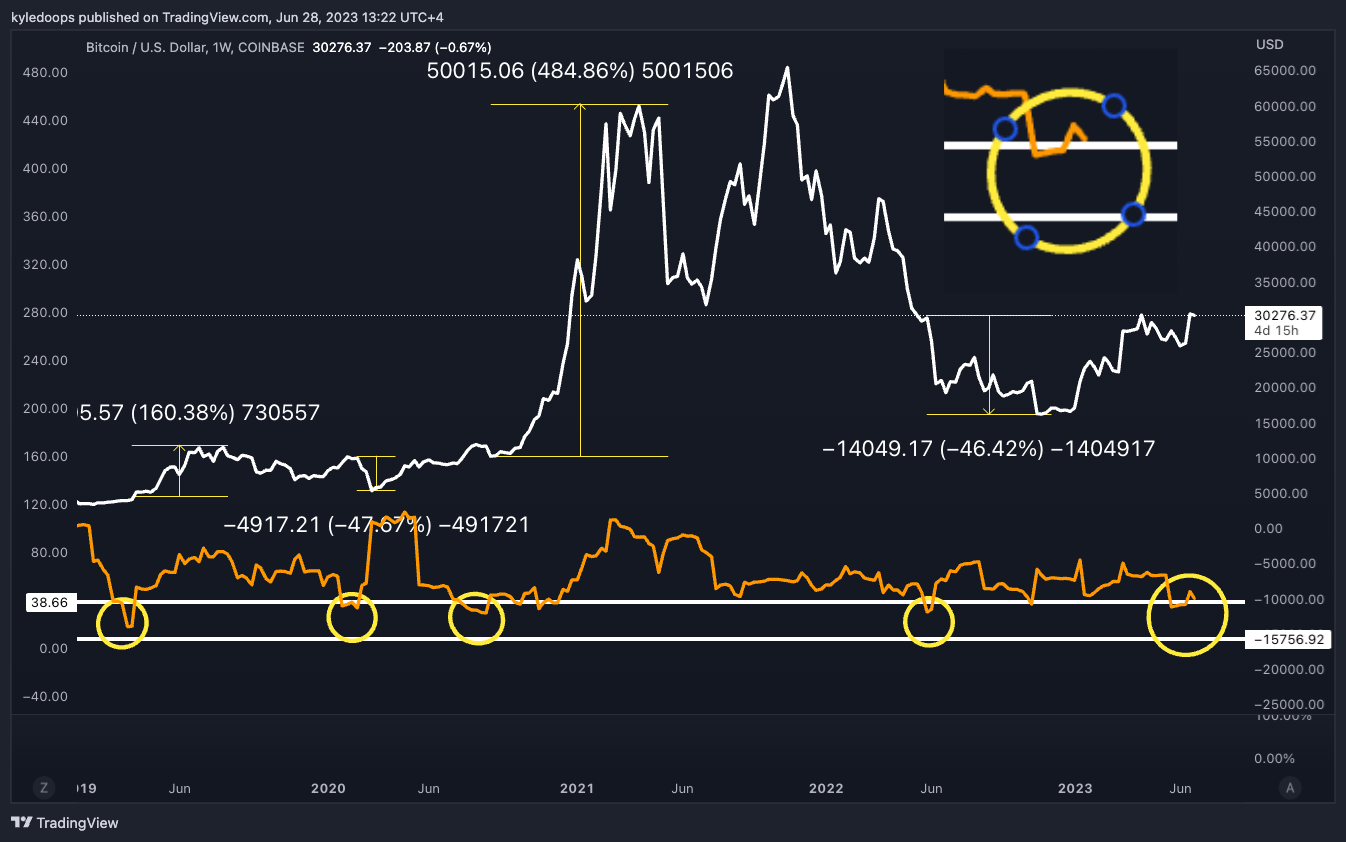
Chart #3 - Bitcoin (BTCUSD) 1-Week Chart
Chartist: Kyle
(For the chart screenshot, click here.)
Bitcoin continues to uphold its structure and its upward trend. The lower band shows Bitcoin's volatility.
Each time BTC has entered and then exited the lower band, it has been met with a massive move indicating expansion. As shown on the superimposed portion of the chart, short-term volatility has decreased, which is what you would typically expect following a major move. The next uptick will trigger our next significant move.
Areas of interest for BTC would be at the $32,000 mark, and then, assuming volatility continues to expand, the next target would be $36,000.
Claim your Bitget sign-up bonuses here (details below).
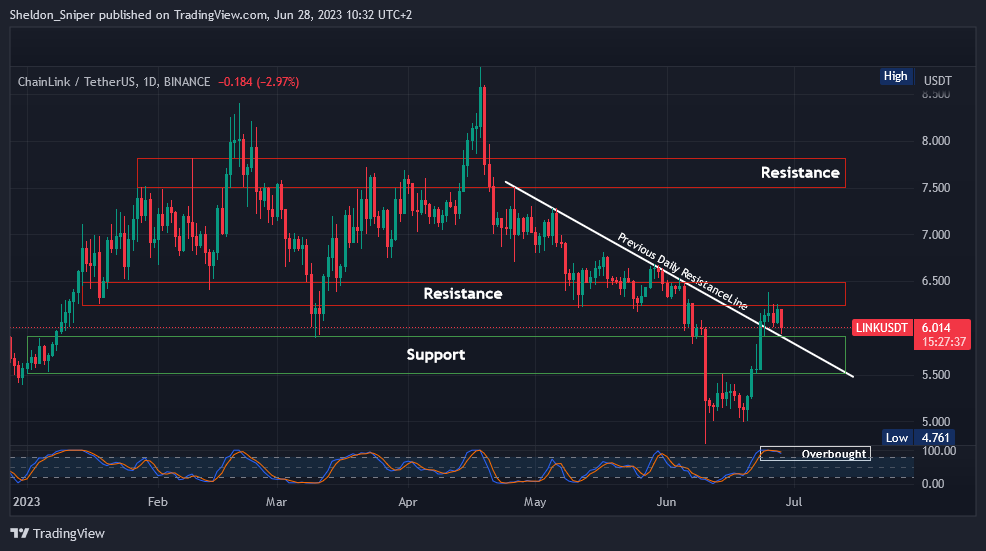
Chart #4 - Chainlink (LINKUSDT) 1-Day Chart
Chartist: Sheldon
(For the chart screenshot, click here.)
In the past two weeks, LINK has seen a significant surge, with the price rallying from $5 to $6.40 before encountering resistance a few days ago.
The price is currently oversold on the daily timeframe, and I anticipate a retrace potentially to the next support area that lies between $5.50 - $6.00. This support region could provide an entry point for a long trade, allowing it to then go and test higher resistance areas as targets.
The first resistance range is between $6.30 - $6.50, followed by $7.00, and the major resistance area of $7.50 - $8.00 beyond that.
LINK has been consolidating for over a year now, and it may be poised for a substantial upward move in the coming weeks.
Claim your Bitget sign-up bonuses here (details below).
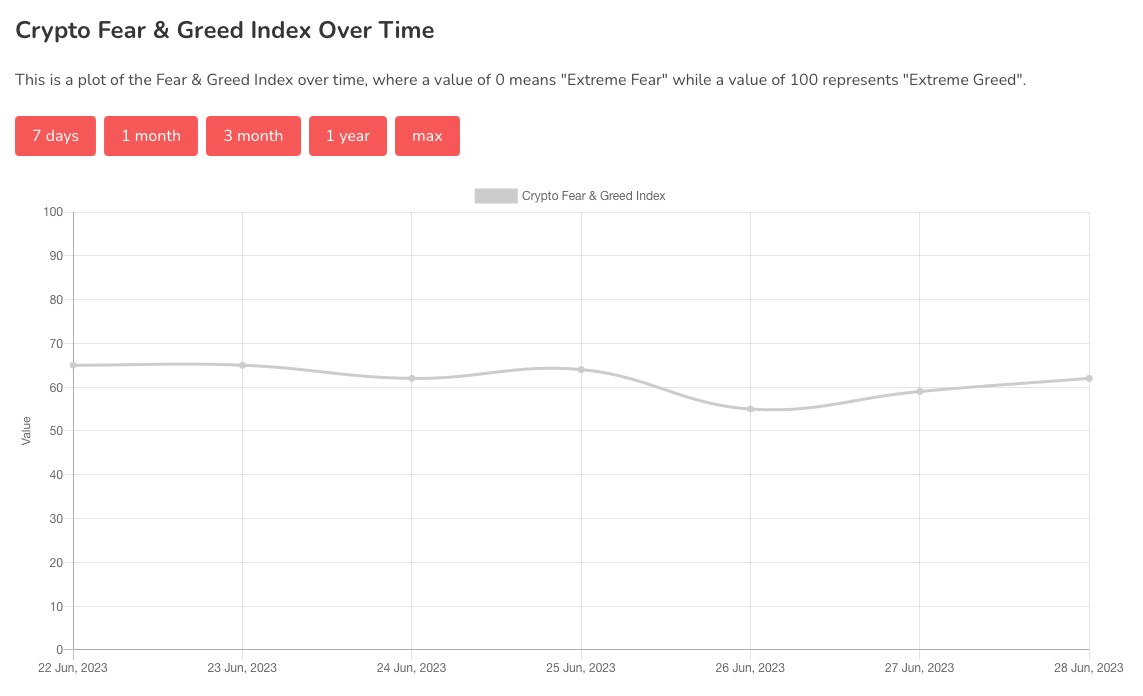
Chart #5 - Bitcoin Fear and Greed Index
The Bitcoin Fear and Greed Index is sitting at 62 today, indicating Greed.
The highest the index has been over the past seven days is 65, and the lowest is 55.
Banter’s Take
So long as Bitcoin maintains above the $28,500 level, bulls are still in control. Simple!
Stay safe my friends!
Go to our Crypto Banter Discord here where Sheldon and Kyle give updates on the charts and trades from The Daily Candle newsletter!