

📈📉 Bitcoin and S&P 500 at significant resistance! Is BNB about to drop?
📈📉 Bitcoin and S&P 500 at significant resistance! Is BNB about to drop?
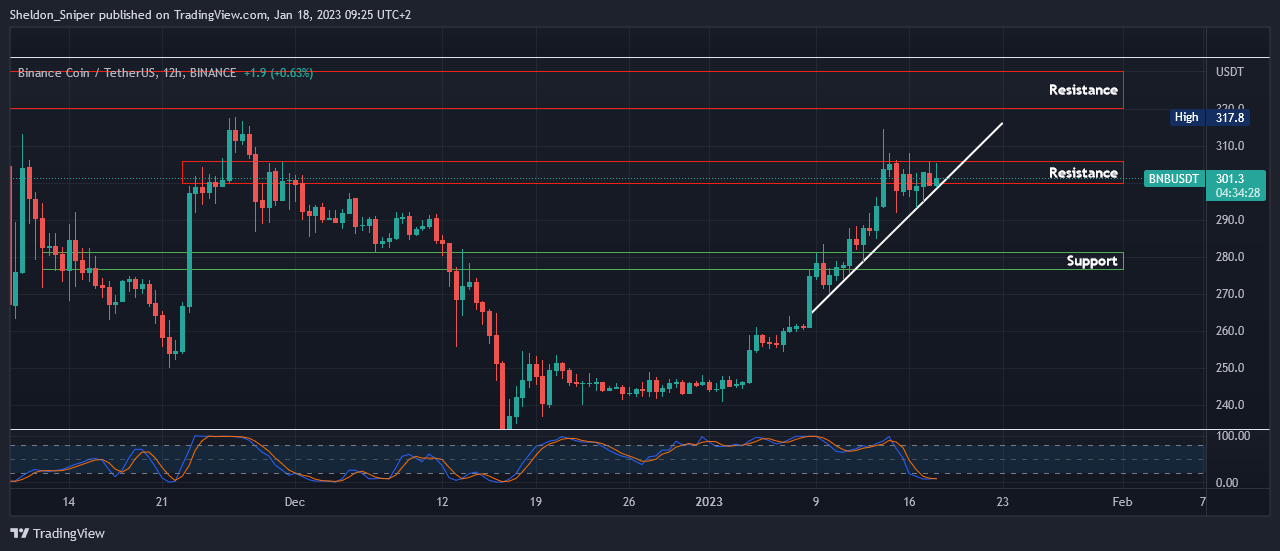
Chart #1 - Binance Coin (BNBUSDT) 12-Hour Chart
Chartist: Sheldon
(For the chart screenshot, click here.)
BNB - the fourth biggest coin by market cap - is quickly becoming a coin investors are showing lots of interest in.
It is currently at $300 (resistance) and is overbought on a daily timeframe, but that does not mean it can't go up further, since the US stock markets and the DXY have not shown any sign of a correction yet.
If the $300 level breaks, the next resistance is at $320 - $330. If the price gets rejected at this level, and the daily support line breaks, the next level of support is around $280.
Check our Crypto Banter Discord here for updates!
Follow me on Twitter for urgent updates on my trading progress!
Claim your Bitget sign-up bonuses here (details below).
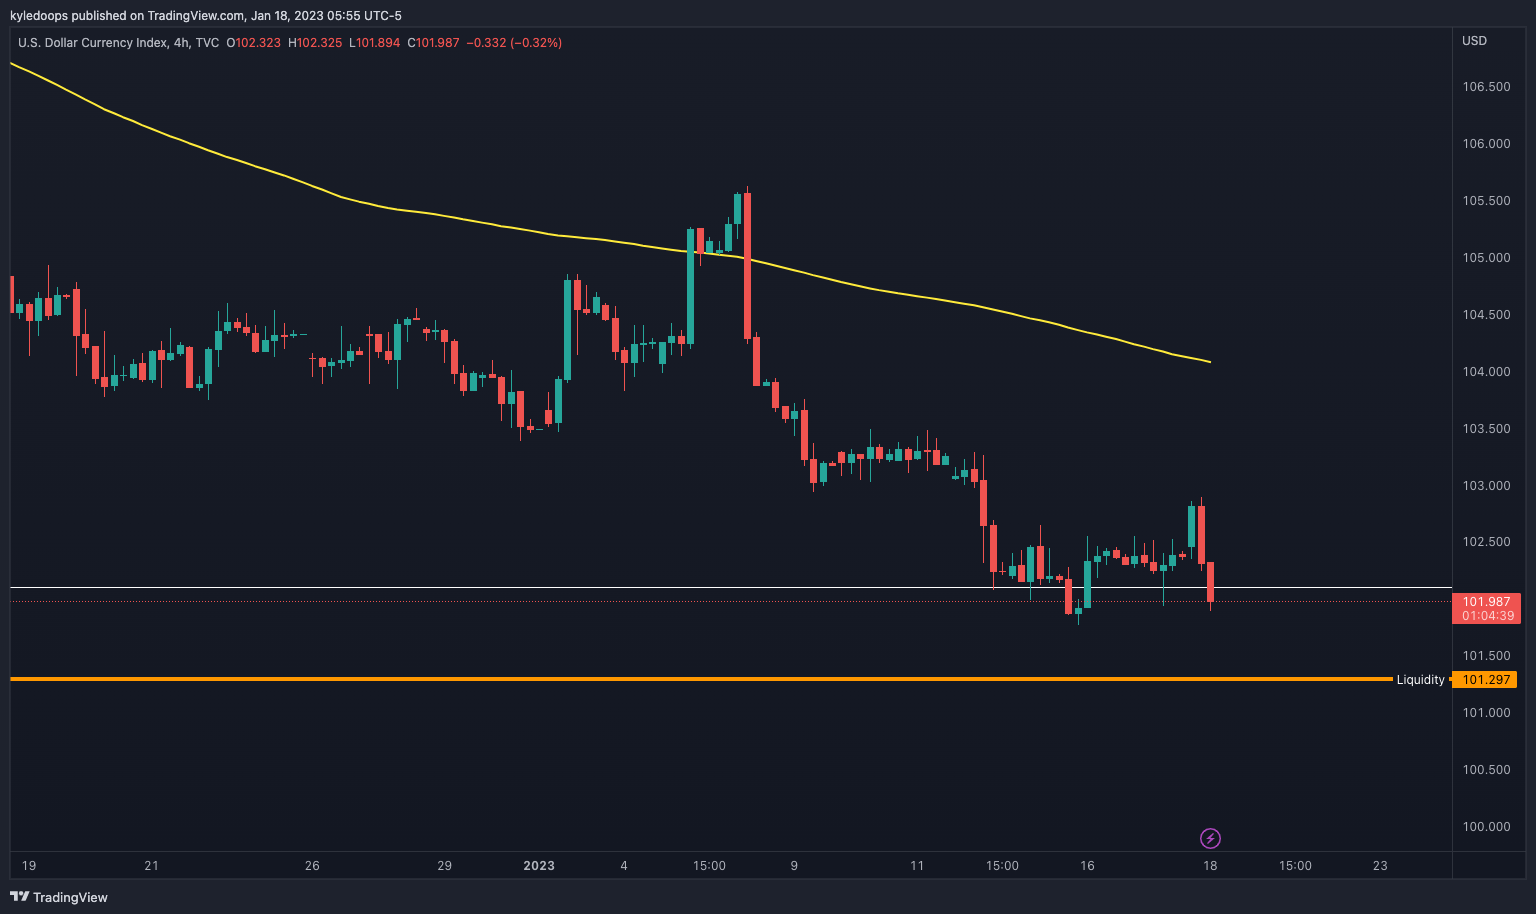
Chart #2 - US Dollar Currency Index (DXY) 4-Hour Chart
Chartist: Kyle
(For the chart screenshot, click here.)
The DXY is quickly approaching its liquidity zone at 101.29.
A big bounce from the DXY at these levels could cause major reactions for both the stock market (currently at 4,012, and knocking on the door of resistance) and bitcoin, which is also nearing resistance following eighteen days of straight up only.
For the next 24 - 48 hours, I will be laser-focused on the DXY, as it could provide some signs of what comes next.
Check our Crypto Banter Discord here for updates!
Make sure to follow me on Twitter, where I will post updates on my trades as they unfold!
Claim your Bitget sign-up bonuses here (details below).
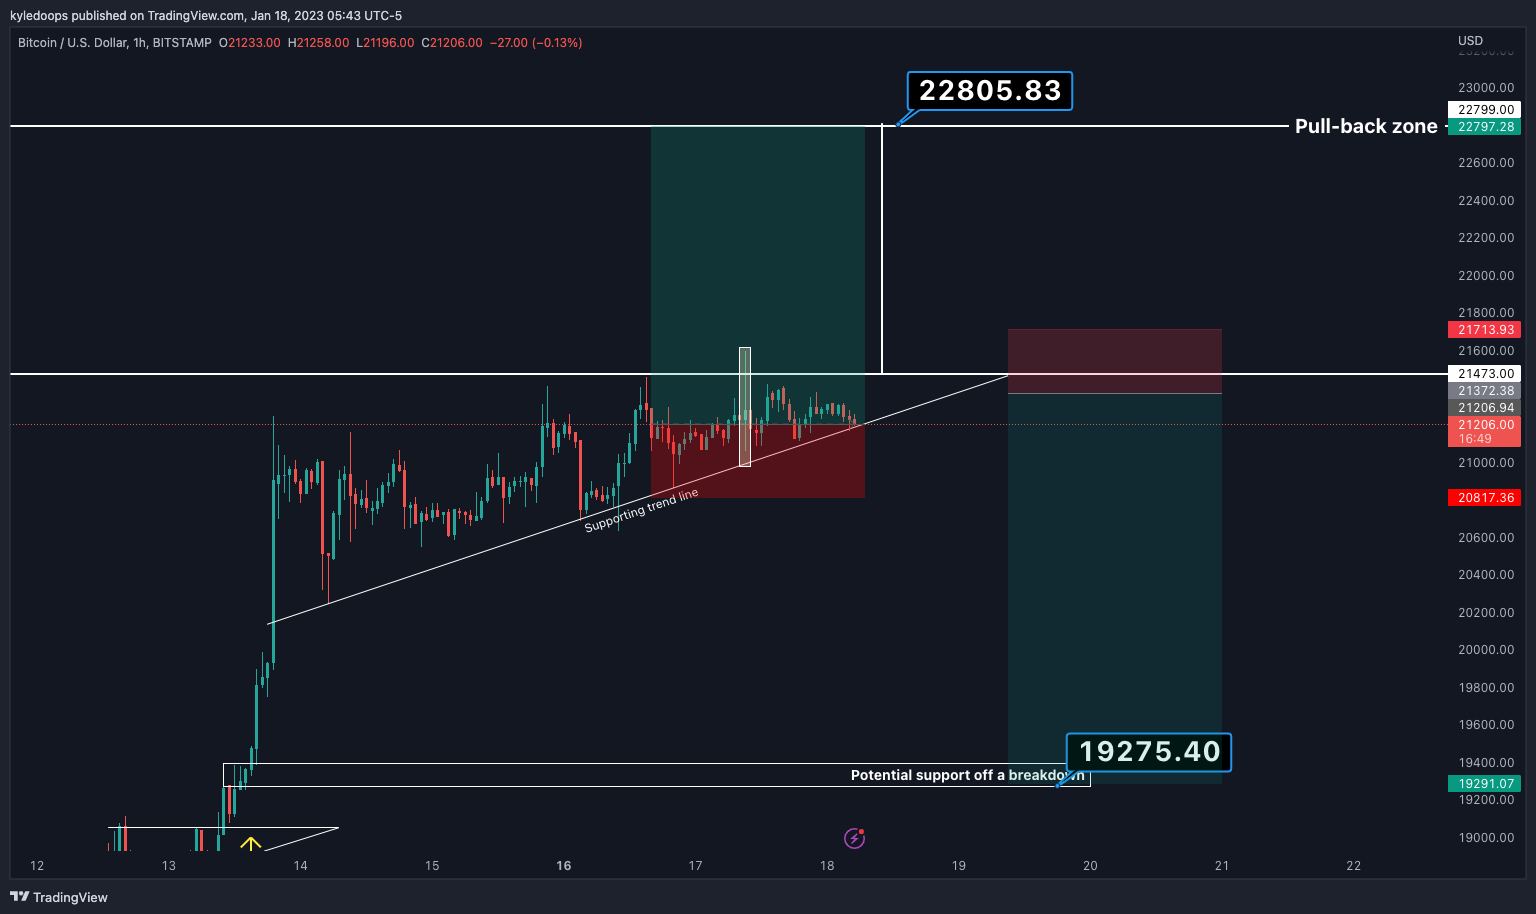
Chart #3 - Bitcoin (BTCUSD) 1-Hour Chart
Chartist: Kyle
(For the chart screenshot, click here.)
Currently, bitcoin is in a tight spot.
As you can see, it's grinding up against resistance but still forming higher lows throughout. When the price grinds into resistance like this, it often leads to a breakout. In this case, it would take the price up to $22,797 - the final take profit target for me on my long position.
But if BTC breaks below the trend line, there is a risk of a Bart Simpson pattern playing out, which would mean a target price of $19,275.
A double trade offers us a hedge opportunity to participate in the upcoming volatility and make money while risking very little.
Check our Crypto Banter Discord here for updates!
Make sure to follow me on Twitter, where I will post updates on my trades as they unfold!
Claim your Bitget sign-up bonuses here (details below).
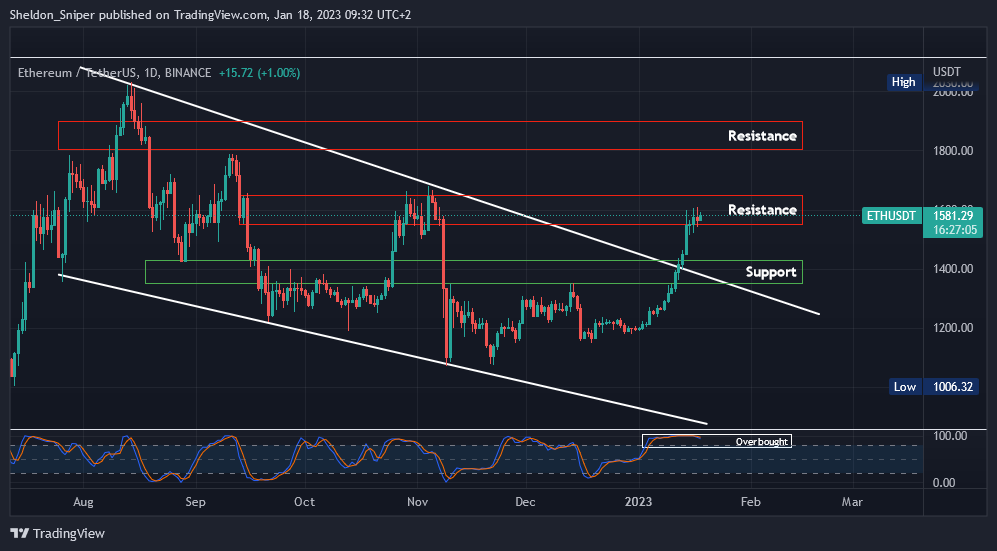
Chart #4 - Ethereum (ETHUSDT) 1-Day Chart
Chartist: Sheldon
(For the chart screenshot, click here.)
ETH has had a massive 30% run this year, increasing from $1,200 to $1,600.
It is now trading in an area of resistance, and the daily indicators are overbought. If it gets rejected here, the next level of support is at $1,500, followed by $1,380 - $1,430. The daily indicators are overbought, but ETH could still move higher, with the next resistance level at around $1,700, followed by the $1,800 - $1,900 area.
Check our Crypto Banter Discord here for updates!
Follow me on Twitter to get all the updates on my personal trading progress!
Claim your Bitget sign-up bonuses here (details below).
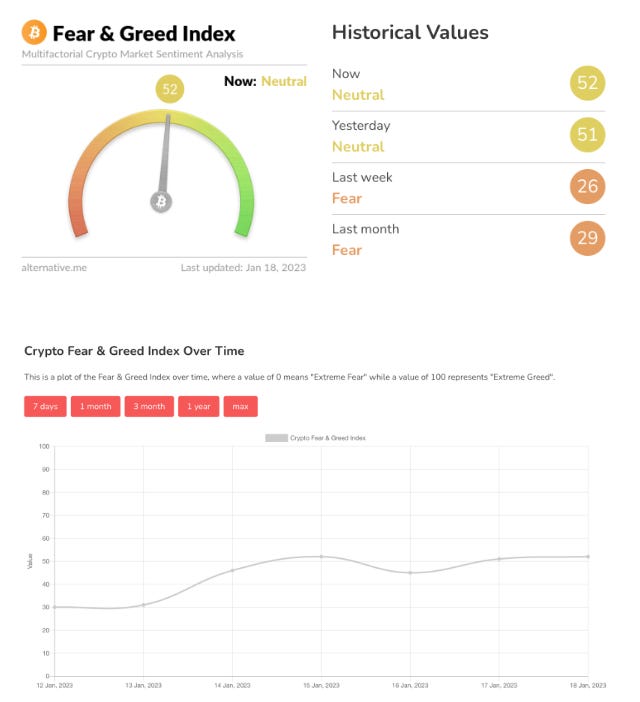
Chart #5 - Bitcoin Fear and Greed Index
The Bitcoin Fear and Greed Index is sitting at 52 today, in Neutral territory.
The highest the index has been over the past seven days is 52, and the lowest is 30.
Overall Market Sentiment (Banter’s Take)
We are in for some significant days ahead as bitcoin and the S&P 500 are at resistance, while the DXY and VIX are at support. Checking which one of them reacts first may paint an early picture of what to expect next.
Stay safe my friends!