

📈📉 Bitcoin blasts past $30k! Can alts catch up?
📈📉 Bitcoin blasts past $30k! Can alts catch up?

Bitget winner - 1191312170
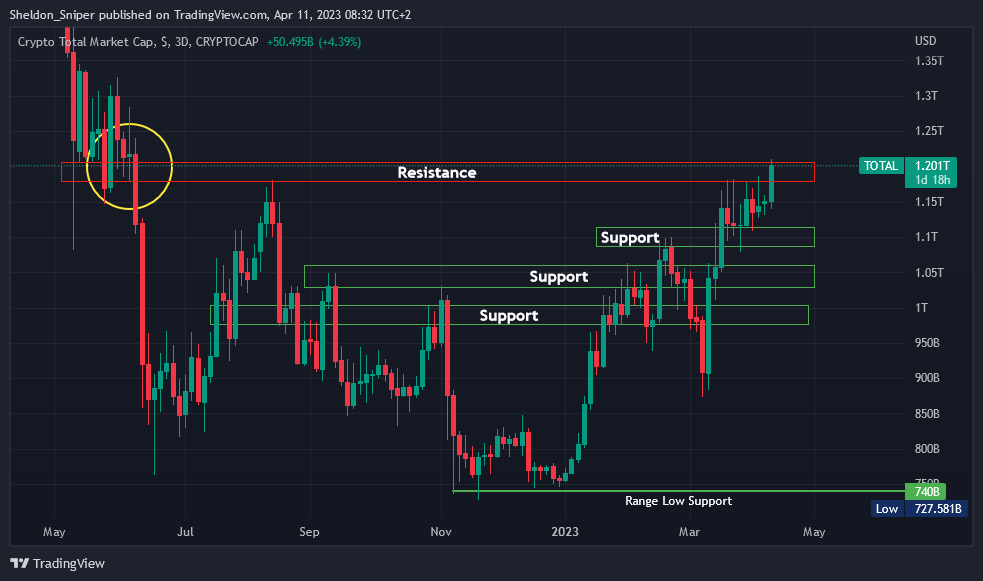
Chart #1 - TOTAL 3-Day Chart
Chartist: Sheldon
(For the chart screenshot, click here.)
Last night, the TOTAL broke through resistance at $1.18 trillion - a level it has been trying to breach for the last three weeks.
Currently, at $1.2T, it is still within a larger overall resistance zone - the same one that held as crucial support in May-June last year before the Luna collapse.
If the TOTAL successfully breaks this current (very tough) area of resistance, the next one is between $1.3T - $1.35T. If the TOTAL gets rejected though, the next support level is at $1.1T, and below that at $1.00T - $1.05T.
𝗣𝗿𝗶𝗺𝗲 𝗫𝗕𝗧
Sign up for a new Trading Account on Prime XBT!
Receive a deposit bonus of up to $7,000 with promo code: SheldonSniper
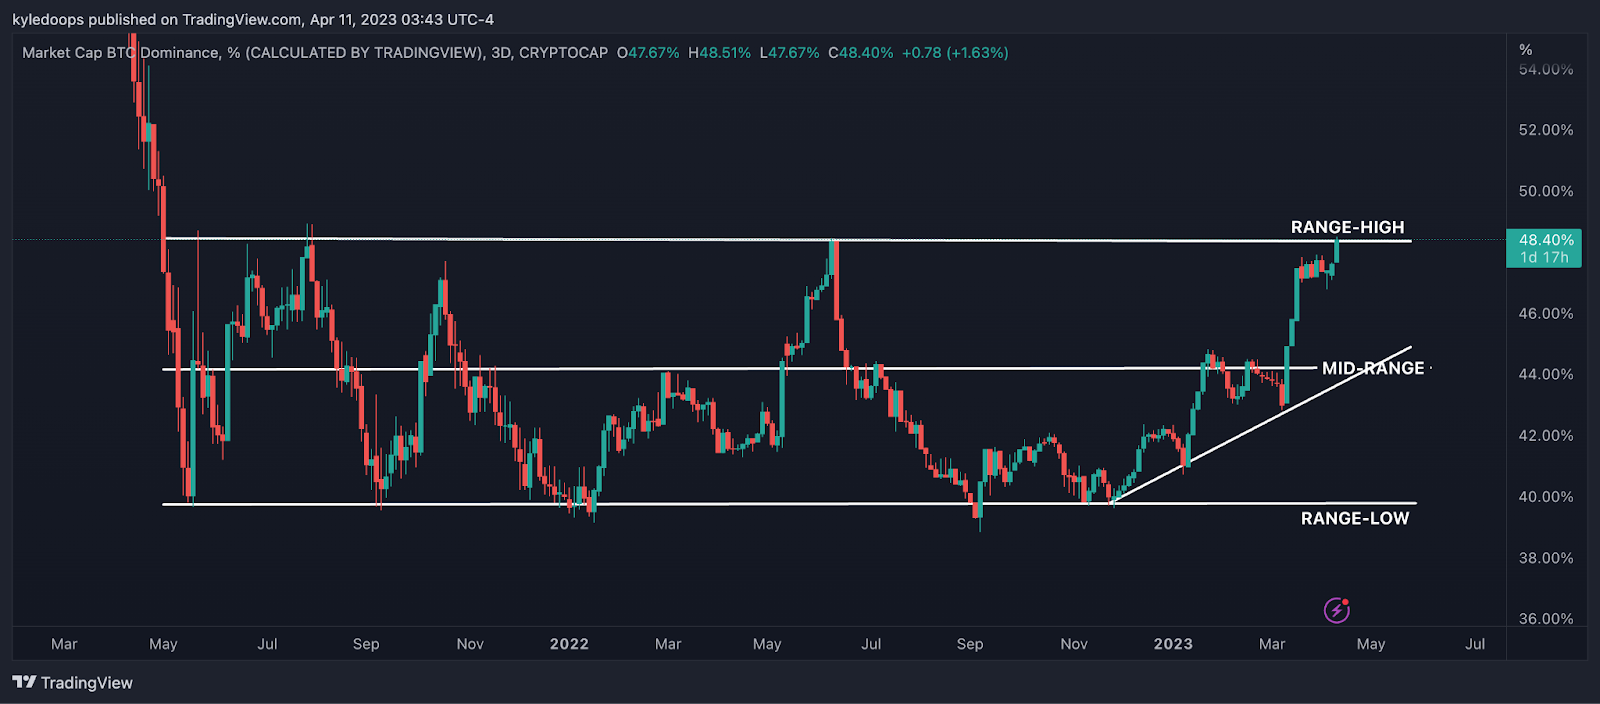
Chart #2 - Bitcoin Dominance (BTC.D) 3-Day Chart
Chartist: Kyle
(For the chart screenshot, click here.)
The markets (mostly bitcoin) are pumping, and BTC Dominance on the 3-day chart is coming up to its range high of 48.40%.
A rejection off of this level could mean that altcoins start to catch a bid.
But an altseason doesn't mean everything pumps equally. We should keep altcoins on our watchlist which experience strong moves on their charts when measured against their BTC pair - those will be the ones that run the hardest.
But if bitcoin breaks out of this level, we'll keep holding it and stay away from alts. We'll wait for a couple more daily closes to gather adequate info on the situation.
𝗣𝗿𝗶𝗺𝗲 𝗫𝗕𝗧
Sign up for a new Trading Account on Prime XBT!
Receive a deposit bonus of up to $7,000 with promo code: KyleDoops

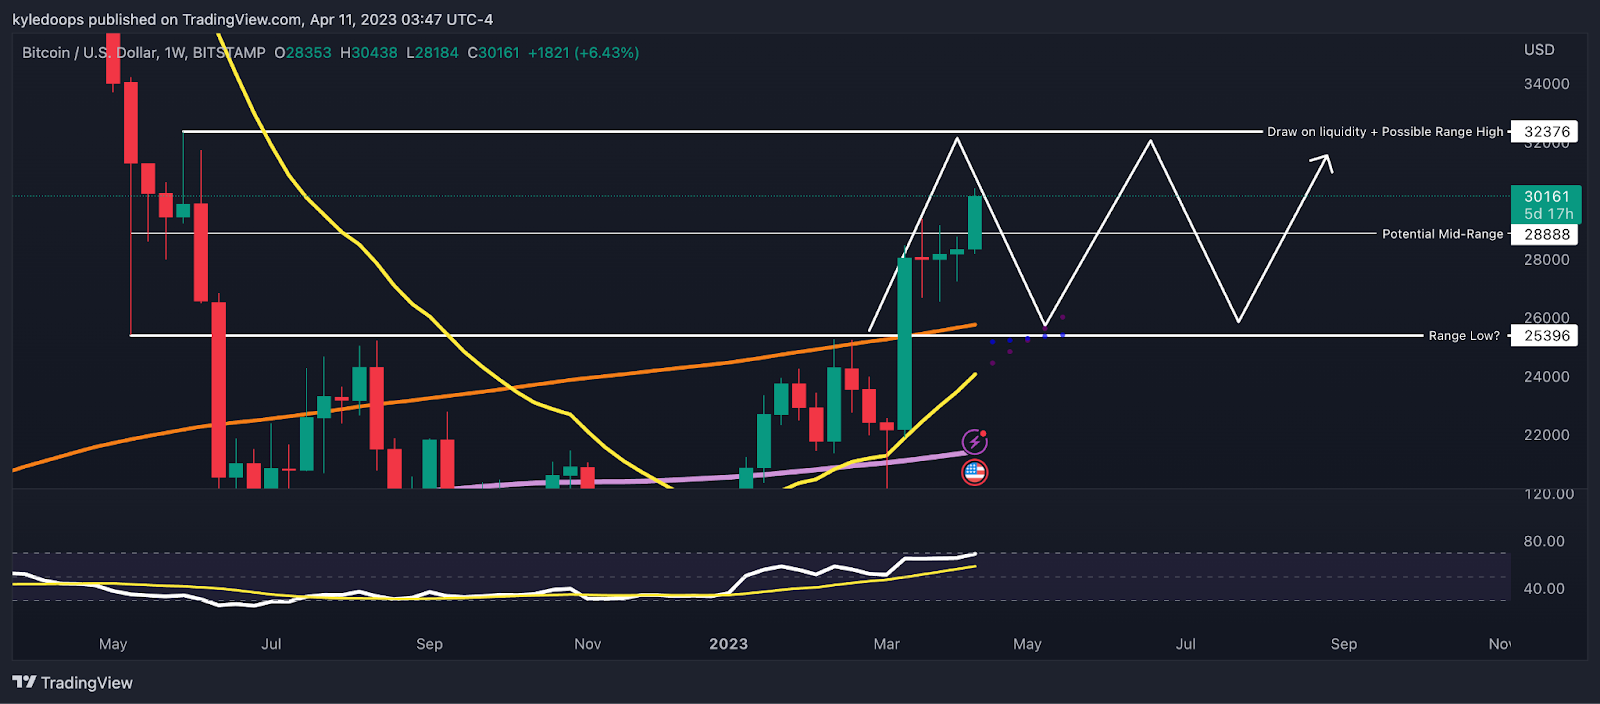
Chart #3 - Bitcoin (BTCUSD) 1-Week Chart
Chartist: Kyle
(For the chart screenshot, click here.)
Bitcoin is potentially establishing a new range following its recent breakout, with it already having cleared the new hypothetical mid-range.
I'll watch for the next draw on liquidity at $32,376, which could potentially be the new range high. The range low would be $25,396.
There is a chance bitcoin moves around between those levels over the next few weeks.
Claim your Bitget sign-up bonuses here (details below).
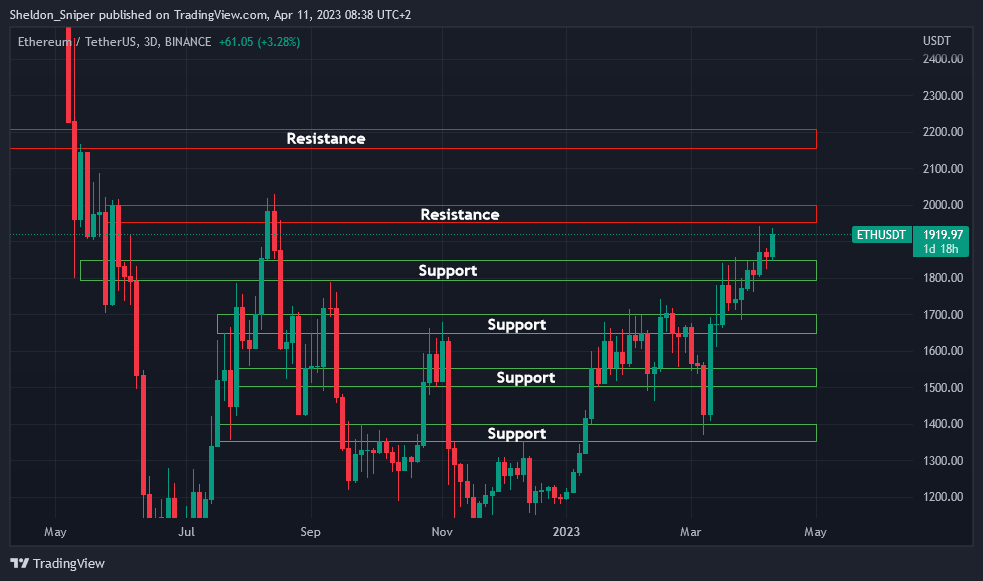
Chart #4 - Ethereum (ETHUSDT) 3-Day Chart
Chartist: Sheldon
(For the chart screenshot, click here.)
Last night ETH rallied from $1,830 to $1,930. And tomorrow is the highly anticipated ETH Shanghai upgrade...
Everyone is wondering whether this will be a “buy the rumor, sell the news” event, with the price selling off right after the upgrade. If ETH can successfully break through its major resistance at $1,950 - $2,000 and turn it into support, it could head up to $2,150 - $2,200.
If it fails, the next support is between $1,800 - $1,850, and below that at $1,650 - $1,700.
The ETH Shanghai upgrade is the most anticipated event in crypto in recent years, so be sure to check in with us at Crypto Banter to get all the alpha you need! And subscribe to the YouTube channel with bell notifications on to get it on time!
Claim your Bitget sign-up bonuses here (details below).
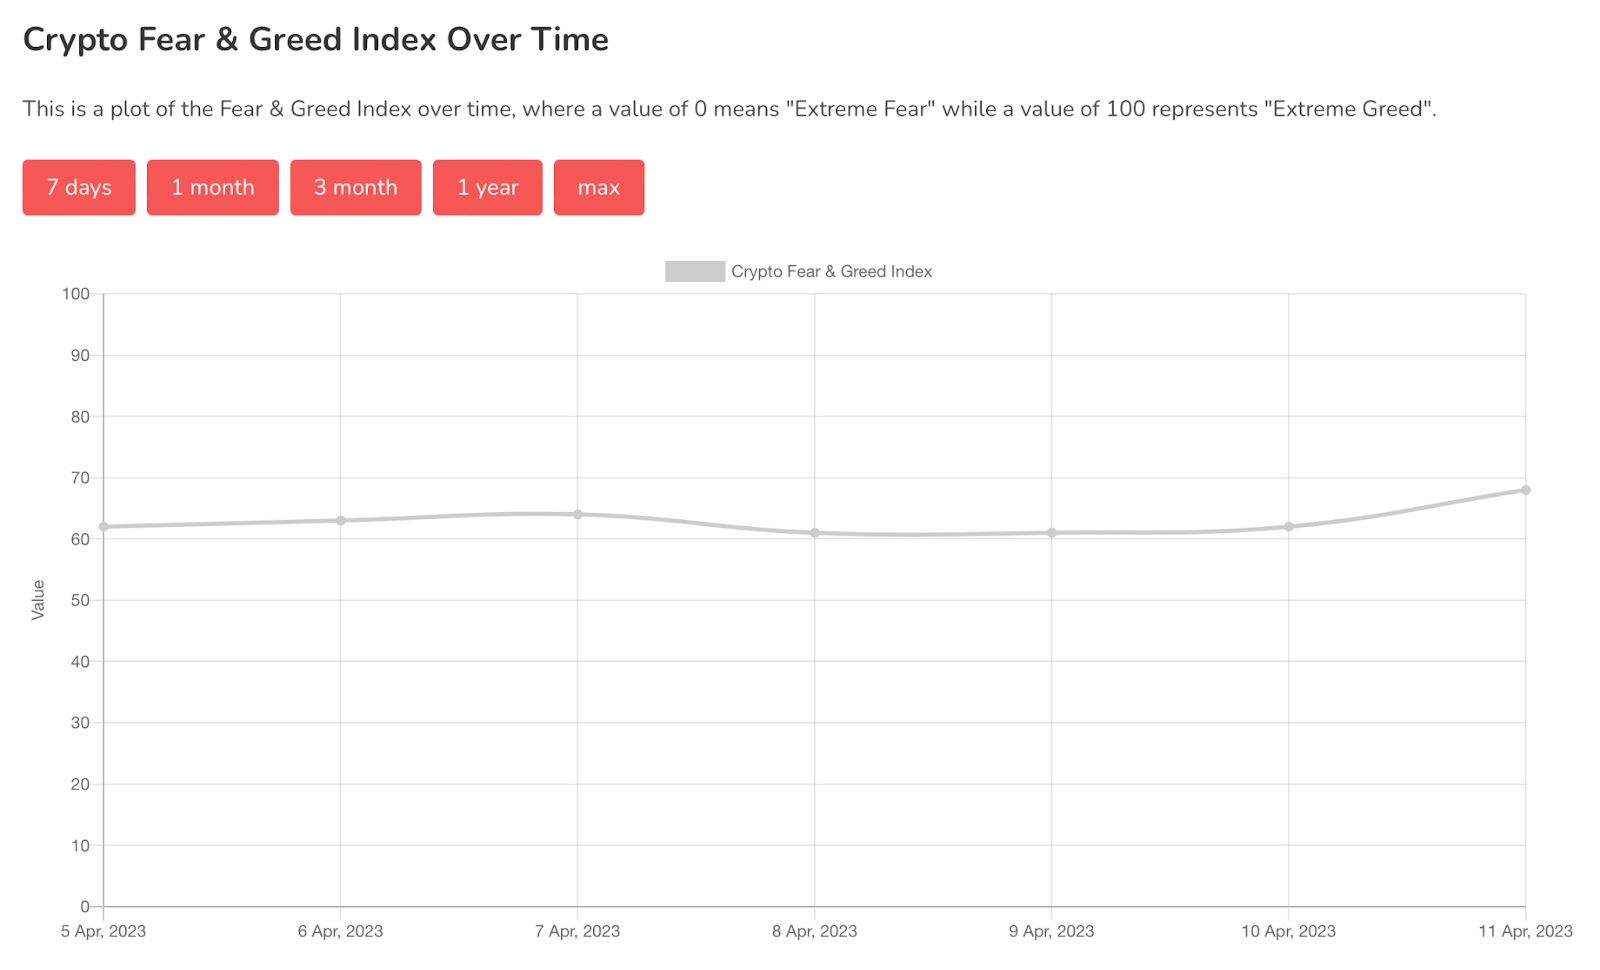
Chart #5 - Bitcoin Fear and Greed Index
The Bitcoin Fear and Greed Index is sitting at 68 today, indicating Greed.
The highest the index has been over the past seven days is 68, and the lowest is 61.
Overall Market Sentiment (Banter’s Take)
A massive breakout in bitcoin and the total market cap suggests new momentum may be coming into the market. And if bitcoin dominance drops, then altcoins will start taking off. But it's too soon to pull that trigger, and patience needs to be employed as we wait for confirmation.
Stay safe my friends!
Go to our Crypto Banter Discord here where Sheldon and Kyle give updates on the charts and trades from The Daily Candle newsletter!
Bybit winner - 2760694