

📈📉 Bitcoin BREAKS TREND! Can it Close the Month on GREEN?
📈📉 Bitcoin BREAKS TREND! Can it Close the Month on GREEN?
Bulls have an opportunity to close the week and the month in the green!
Overview
Chart #1 - Fantom (FTMUSDT) Daily
Chart #2 - Bitcoin (BTCUSD) Daily
Chart #3 - S&P 500 Futures (ES1!) Daily
Chart #4 - Polygon (MATICUSDT) Daily
Chart #5 - Fear and Greed Index

Chart #1 - Fantom (FTMUSDT) Daily Chart
Chartist: Sheldon
(For the chart screenshot, click here.)
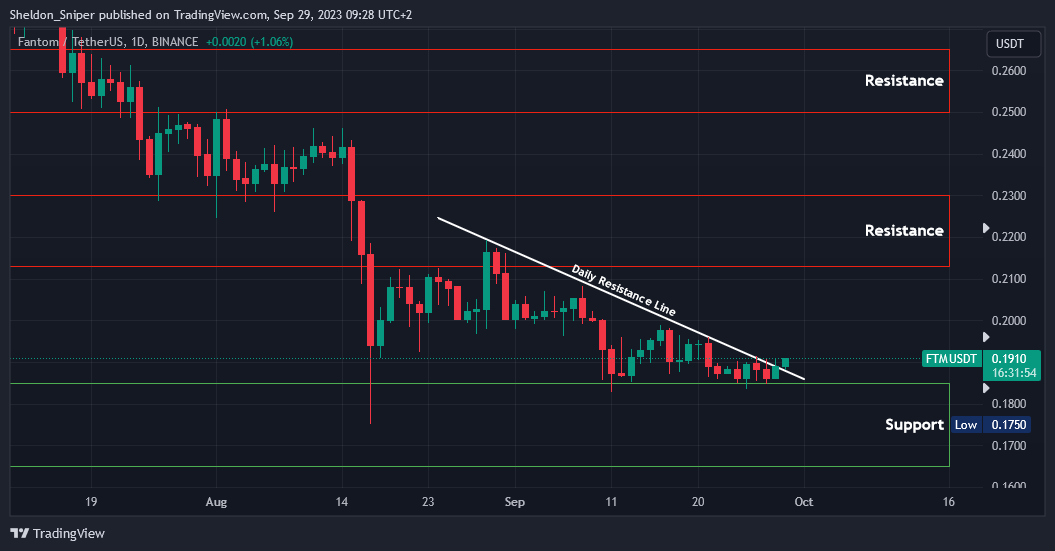
Yesterday, the price of FTM moved higher off the $0.1850 support level and broke through the month-long descending resistance line.
The price is currently just over $0.19 and is once again facing a small level of resistance. BTC, which drives the market, looks very bullish at the moment.
A move higher for BTC should lead FTM to also move higher, possibly testing the next resistance area just above $0.21 or even the $0.23 level.
Sign-up and trade on Bybit today.
Exclusive $30,000 deposit rewards and bonuses up for grabs!
Chart #2 - Bitcoin (BTCUSD) Daily Chart
Chartist: Kyle
(For the chart screenshot, click here.)
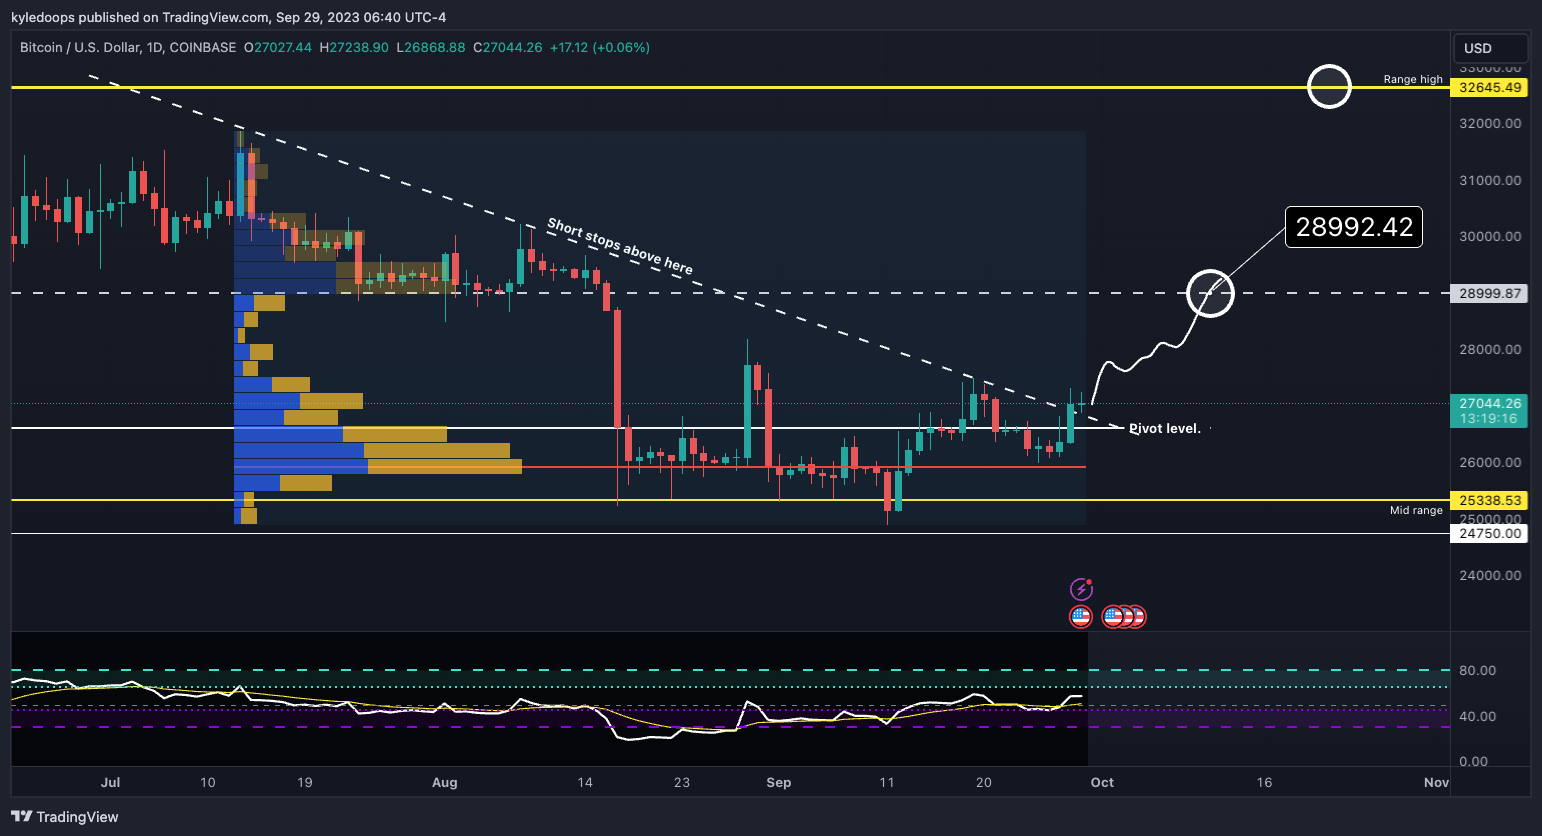
Bitcoin has broken above the downward-sloping trend line, originating from the high volume node at $25,924. So, there's potential for the price to climb further.
Conservative traders might wait for three candle closes above this descending line, which would significantly raise the likelihood of reaching the next target at $29,000, representing the quarterly range.
If the price maintains multiple candle closes at this level, high timeframe indicators may start to turn bullish once more.
Claim your Bitget sign-up bonuses here (details below).
Chart #3 - S&P 500 Futures (ES1!) Daily Chart
Chartist: Kyle
(For the chart screenshot, click here.)
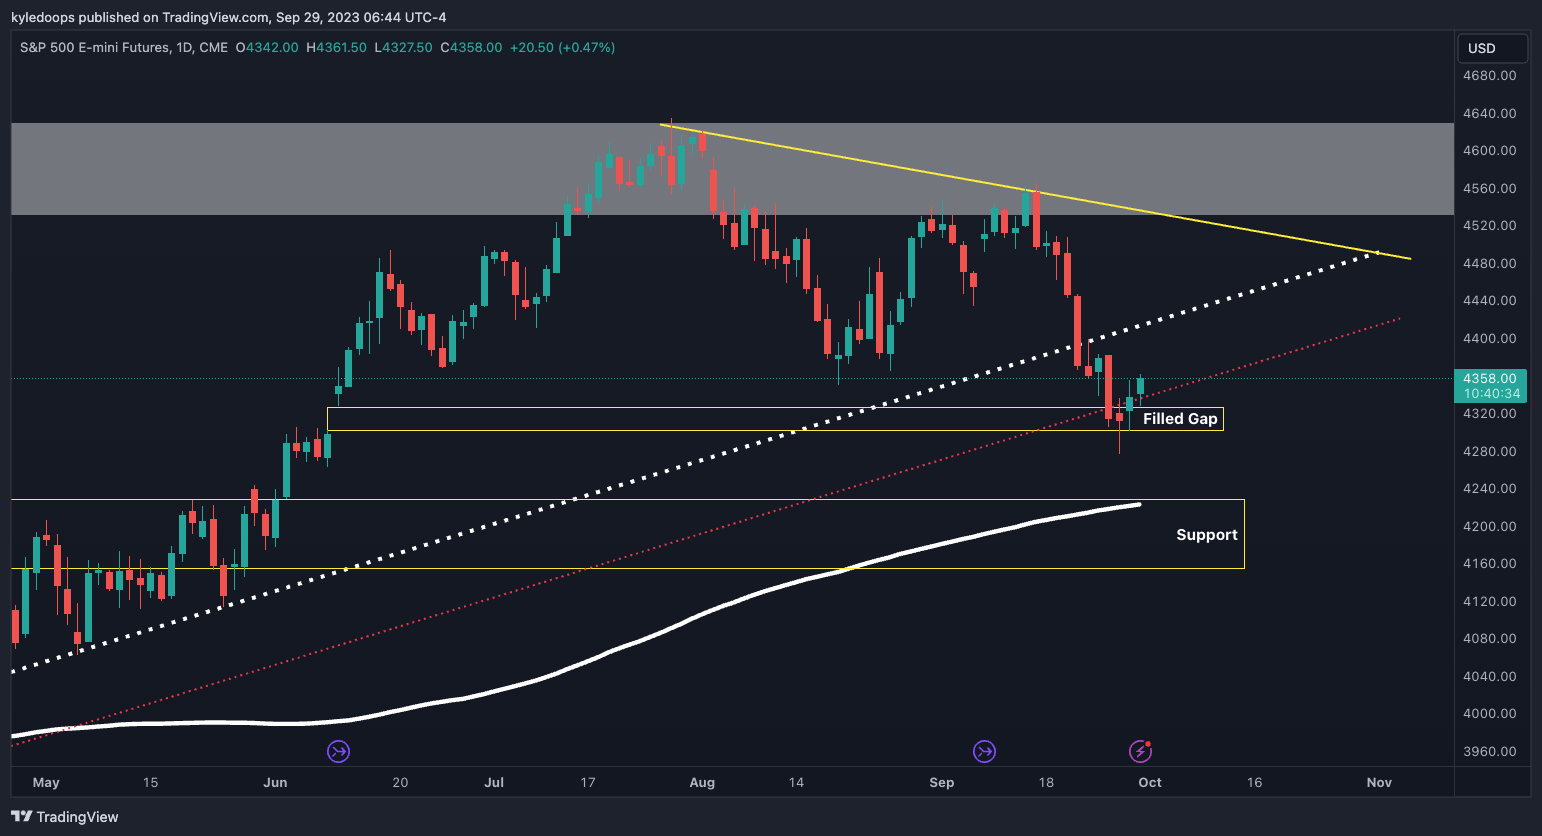
The S&P 500 futures chart is displaying signs of strength emerging from the gap we previously highlighted.
Traders should now be on alert for a potential lower high. If the price continues its rally, the final resistance will be the diagonal yellow line, which is on a downward trend, situated in the 4,500 region.
If there's a rejection at this point, a test of the 200-day MA at 4,200 remains a possibility.
Claim your Bitget sign-up bonuses here (details below).
Chart #4 - Polygon (MATICUSDT) Daily Chart
Chartist: Sheldon
(For the chart screenshot, click here.)
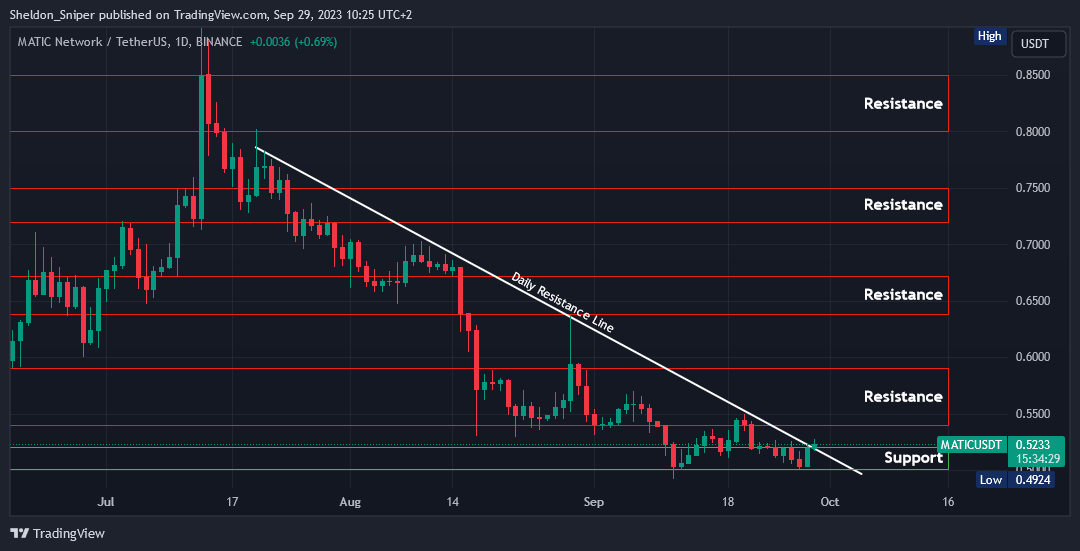
After ranging between the $0.50 - $0.52 support area for the past two weeks, the price of MATIC is currently attempting to breach the descending resistance line stemming from mid-July.
With the market trying to ascend, there's potential for MATIC to rise and test the next resistance at $0.54.
Should it break through this area, there's a possibility it might challenge the subsequent resistance zone of $0.64 - $0.67.
Claim your Bitget sign-up bonuses here (details below).
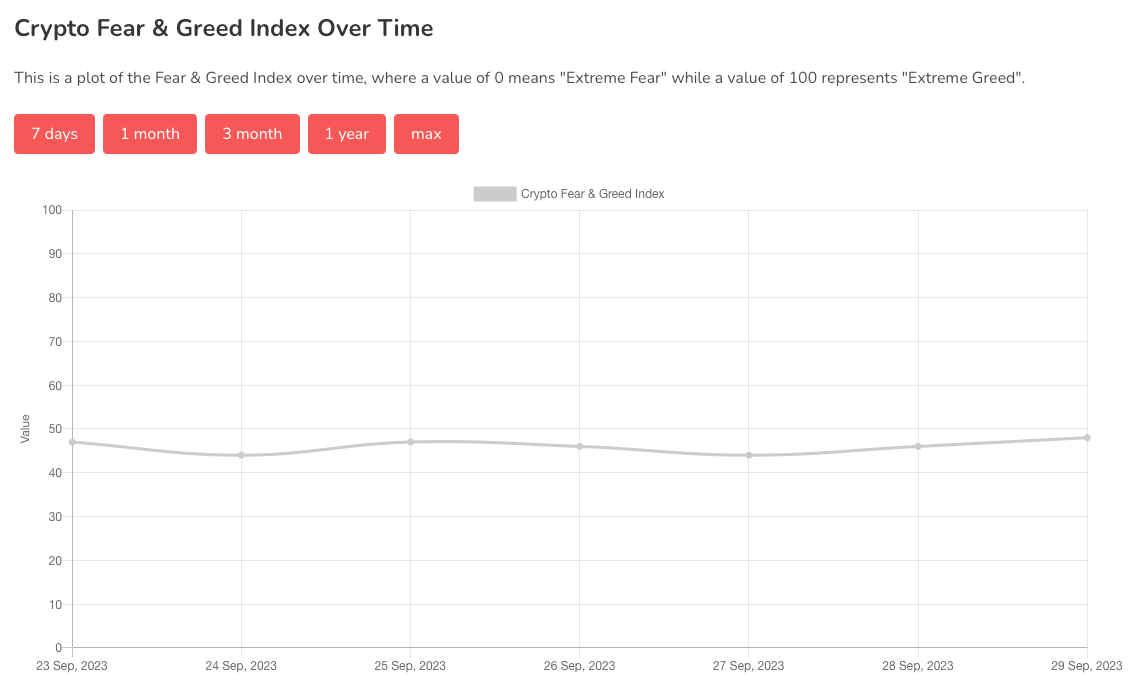
Chart #5 - Fear and Greed Index
The Fear and Greed Index is sitting at 48 today, Neutral.
The highest the index has been over the past seven days is 48, and the lowest is 44.
Banter’s Take
The market seems to be stirring, and the upcoming closes will be pivotal in determining the next moves. Bulls have an opportunity to close the week and the month in the green. This also reflects on the quarterly close, which remains within a defined range.
Stay safe my friends!
Go to our Crypto Banter Discord here where Sheldon and Kyle give updates on the charts and trades from The Daily Candle newsletter!