

📈📉 Bitcoin Bulls ADD Pressure! THIS is the TARGET!
📈📉 Bitcoin Bulls ADD Pressure! THIS is the TARGET!

Overview
Chart #1 - Avalanche (AVAXUSDT) Daily Chart
Chart #2 - Bitcoin (BTCUSD) Daily Chart
Chart #3 - Ethereum (ETHUSD) Daily Chart
Chart #4 - Crypto Total Market Cap (TOTAL) 8-Hour Chart
Chart #5 - Fear and Greed Index

Chart #1 - Avalanche (AVAXUSDT) Daily Chart
Chartist: Sheldon
(For the chart screenshot, click here.)
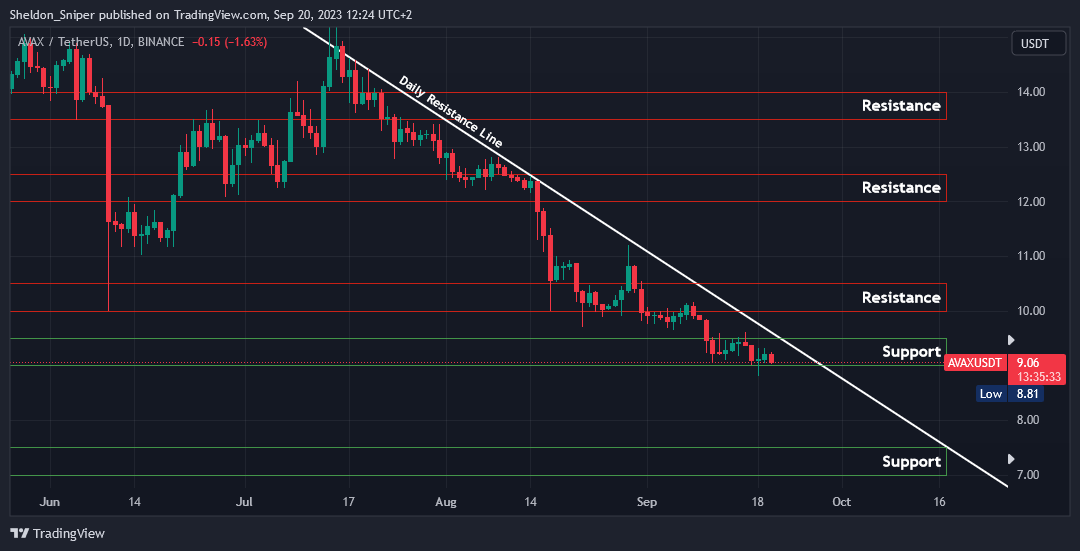
AVAX has been in a steady decline since April and is now very oversold, and it could bounce from $9.00.
I'm watching to see if the price will break the descending resistance line, currently situated around $9.50, before adding additional risk to this trade. The price might easily get rejected at the line once more, resuming its trend down.
A break of the line could drive the price up to $10.00 - $10.50. However, if the price continues downward and loses the $9.00 support level, the next support zone is significantly lower at $7.00 - $7.50.
Sign-up and trade on Bybit today.
Exclusive $30,000 deposit rewards and bonuses up for grabs!
Chart #2 - Bitcoin (BTCUSD) Daily Chart
Chartist: Kyle
(For the chart screenshot, click here.)
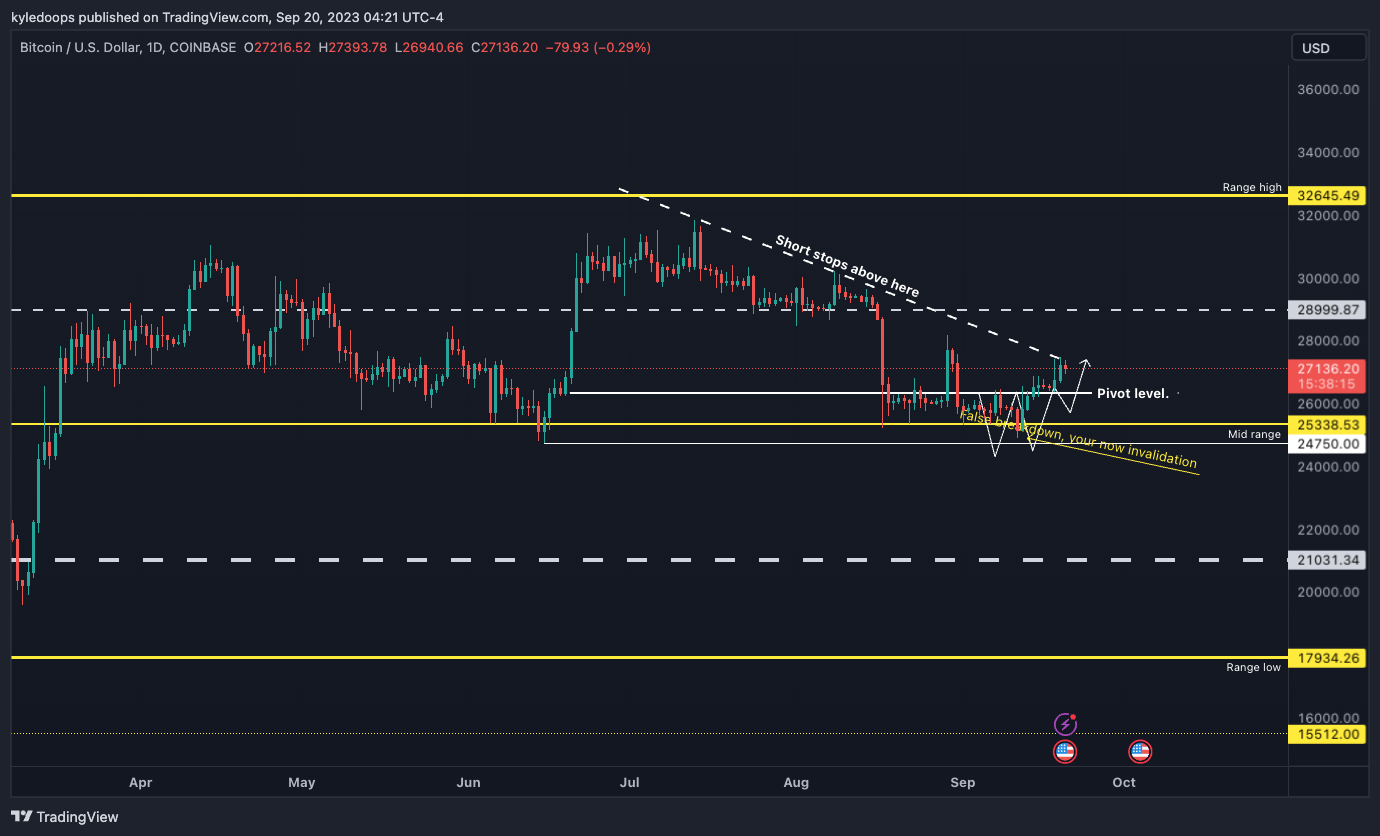
Bitcoin bulls are adding pressure and are soon to break the price through the downward-sloping trend line.
This will lead to a major breakout which will have the price run to $29,000 as the next resistance area, that being the range quarterly. If the price holds above there, then new local highs could be the next level to watch.
As long as the price holds above the mid-level at $25,338, it's ball in the bulls' court.
𝗣𝗿𝗶𝗺𝗲 𝗫𝗕𝗧
Sign up for a new Trading Account on Prime XBT!
Receive a deposit bonus of up to $7,000 with promo code: KyleDoops
Chart #3 - Ethereum (ETHUSD) Daily Chart
Chartist: Kyle
(For the chart screenshot, click here.)
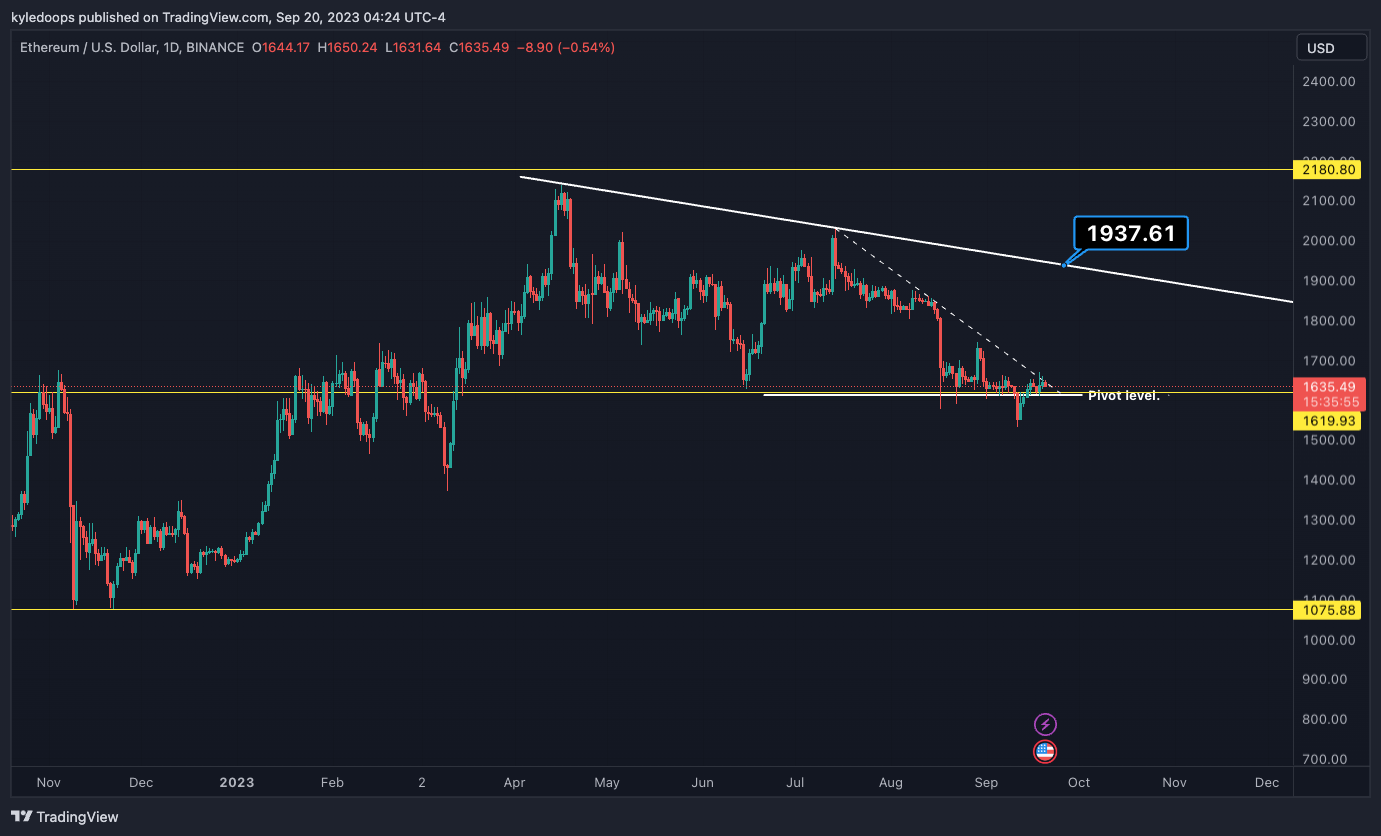
ETH is not as strong as Bitcoin, but a rising tide lifts all ships, which means if Bitcoin breaks its key levels, then you can expect ETH to break towards the upside too.
Major resistance for ETH will be found at $1,937.
Bulls need to maintain the price above $1,619, which is the mid-level of the broader range. If they lose that level, then ETH likely moves towards $1,400.
Claim your Bitget sign-up bonuses here (details below).
Chart #4 - Crypto Total Market Cap (TOTAL) 8-Hour Chart
Chartist: Sheldon
(For the chart screenshot, click here.)
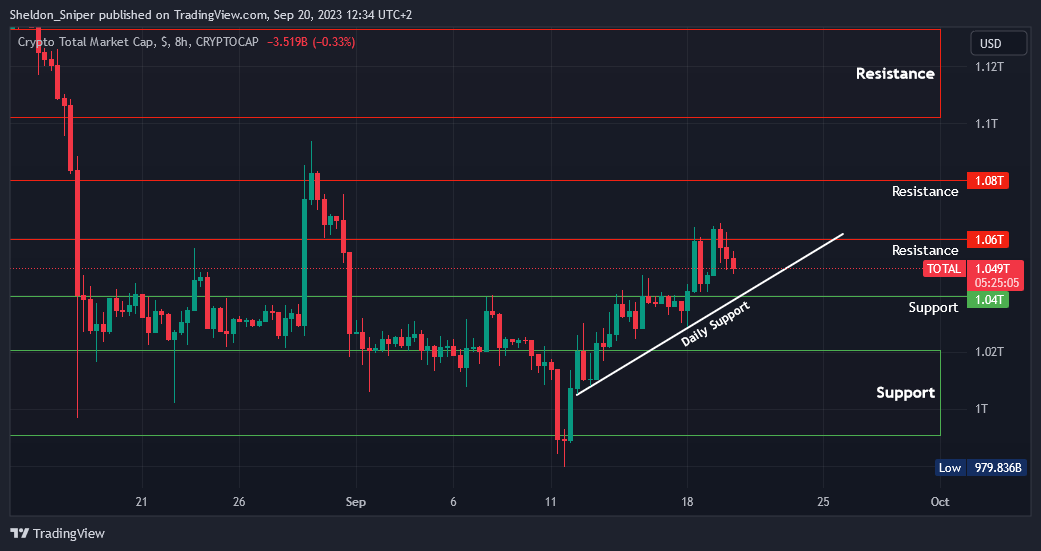
Over the past two days, the TOTAL has been rejected twice at the $1.06T resistance level.
It appears the market might once again approach the support level at $1.04T ahead of tonight's FOMC.
If the Fed keeps the rates steady, I anticipate a move to the upside, testing the $1.08T resistance, or potentially the $1.10T - $1.13T resistance zone. If they raise rates, a retest of the $990B - $1.02T support area might be on the horizon.
Claim your Bitget sign-up bonuses here (details below).
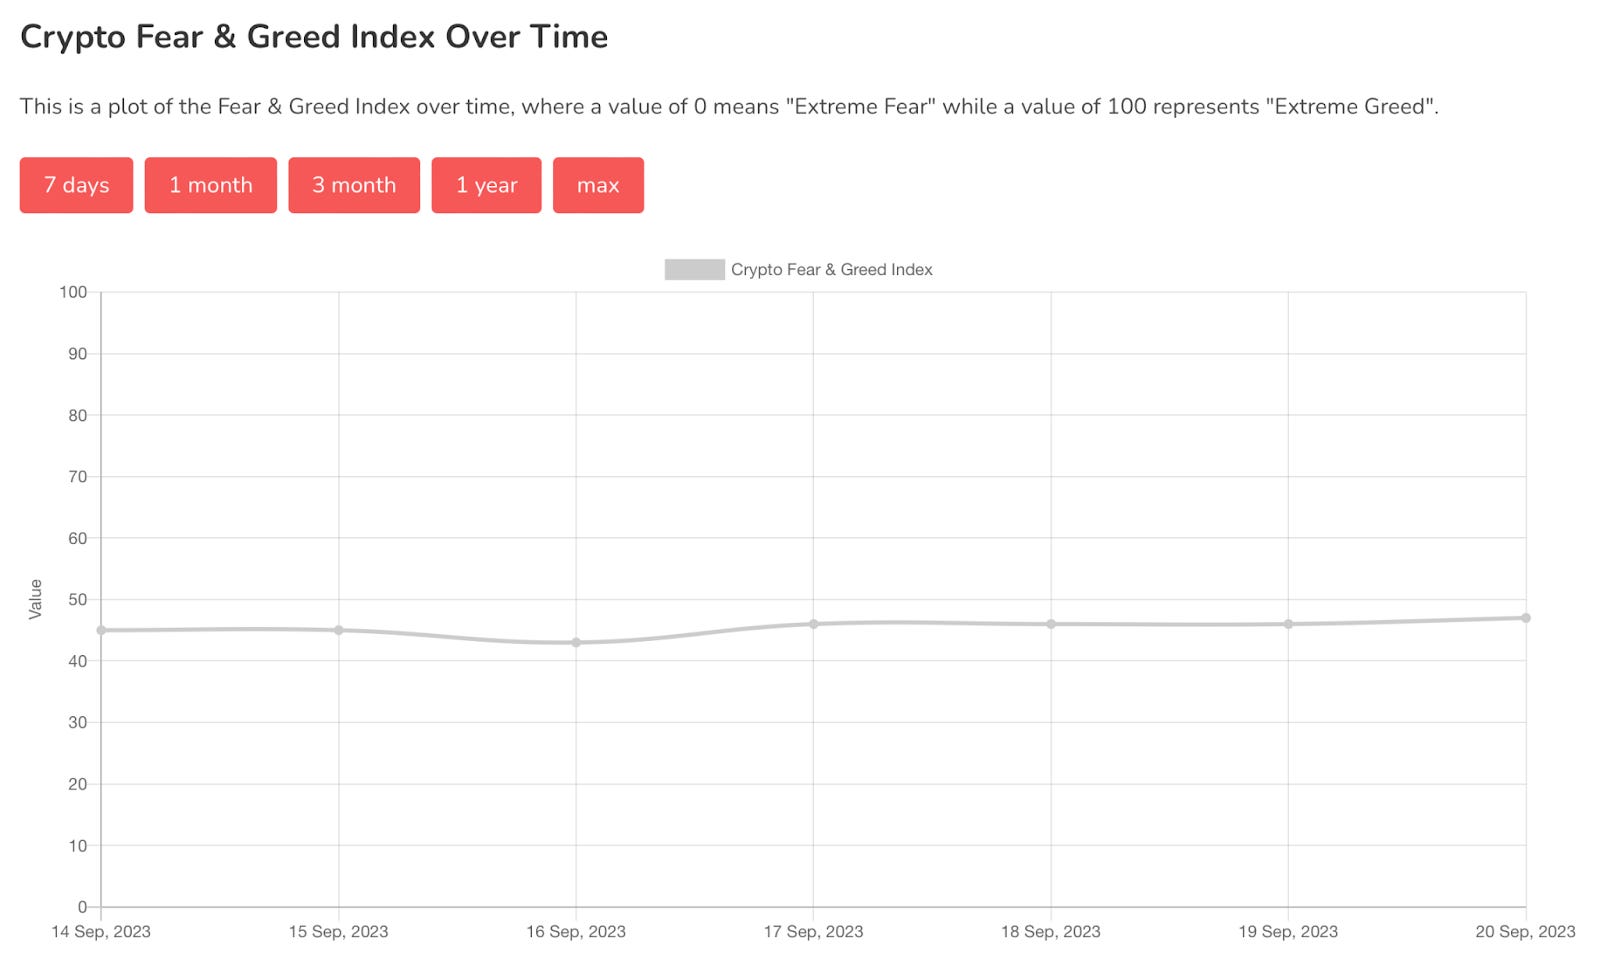
Chart #5 - Fear and Greed Index
The Fear and Greed Index is sitting at 47 today, Neutral.
The highest the index has been over the past seven days is 47, and the lowest is 43.
Banter’s Take
The FOMC announcement is today, and market participants expect no interest rate hike. If there are any hikes, the market will sell off, and all bullish bias will be off the table.
If it comes out as expected, then the market likely continues upward in a slow and controlled manner.
Stay safe my friends!
Go to our Crypto Banter Discord here where Sheldon and Kyle give updates on the charts and trades from The Daily Candle newsletter!