

📈📉 Bitcoin Closes Week Bullish! Time to Enter a Trade?
📈📉 Bitcoin Closes Week Bullish! Time to Enter a Trade?

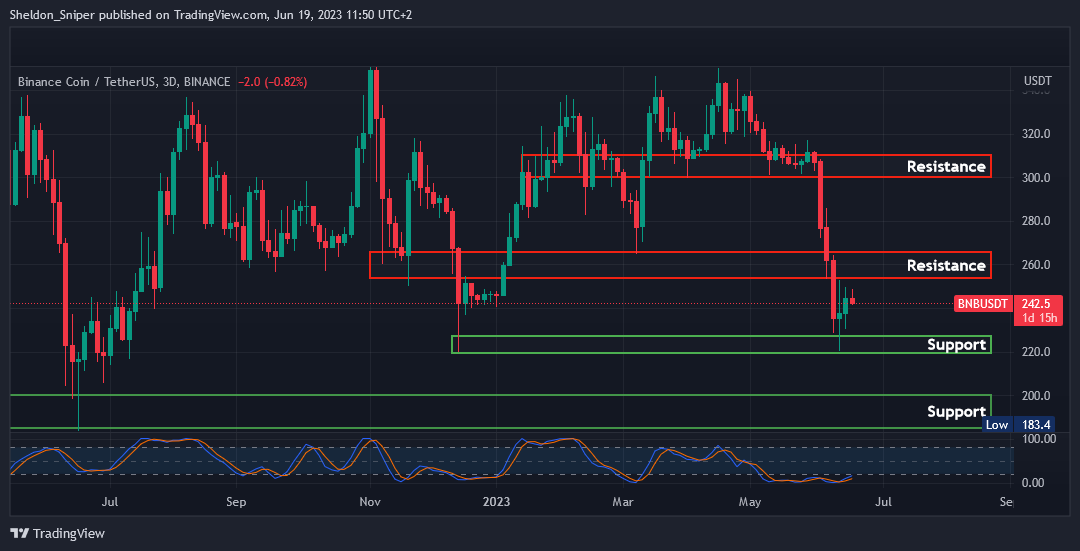
Chart #1 - BNB (BNBUSDT) 3-Day Chart
Chartist: Sheldon
(For the chart screenshot, click here.)
After bouncing off the $220 - $230 support area last week, BNB has been unable to reclaim the resistance area at $250 - $270, facing rejection around the $250 mark.
If BNB fails to reclaim the $250 - $270 level in the next few days (which would then take it to $300 - $310), it will most likely head to $180 - $200.
Sign-up and trade on Bybit today.
Exclusive $30,000 deposit rewards and bonuses up for grabs!
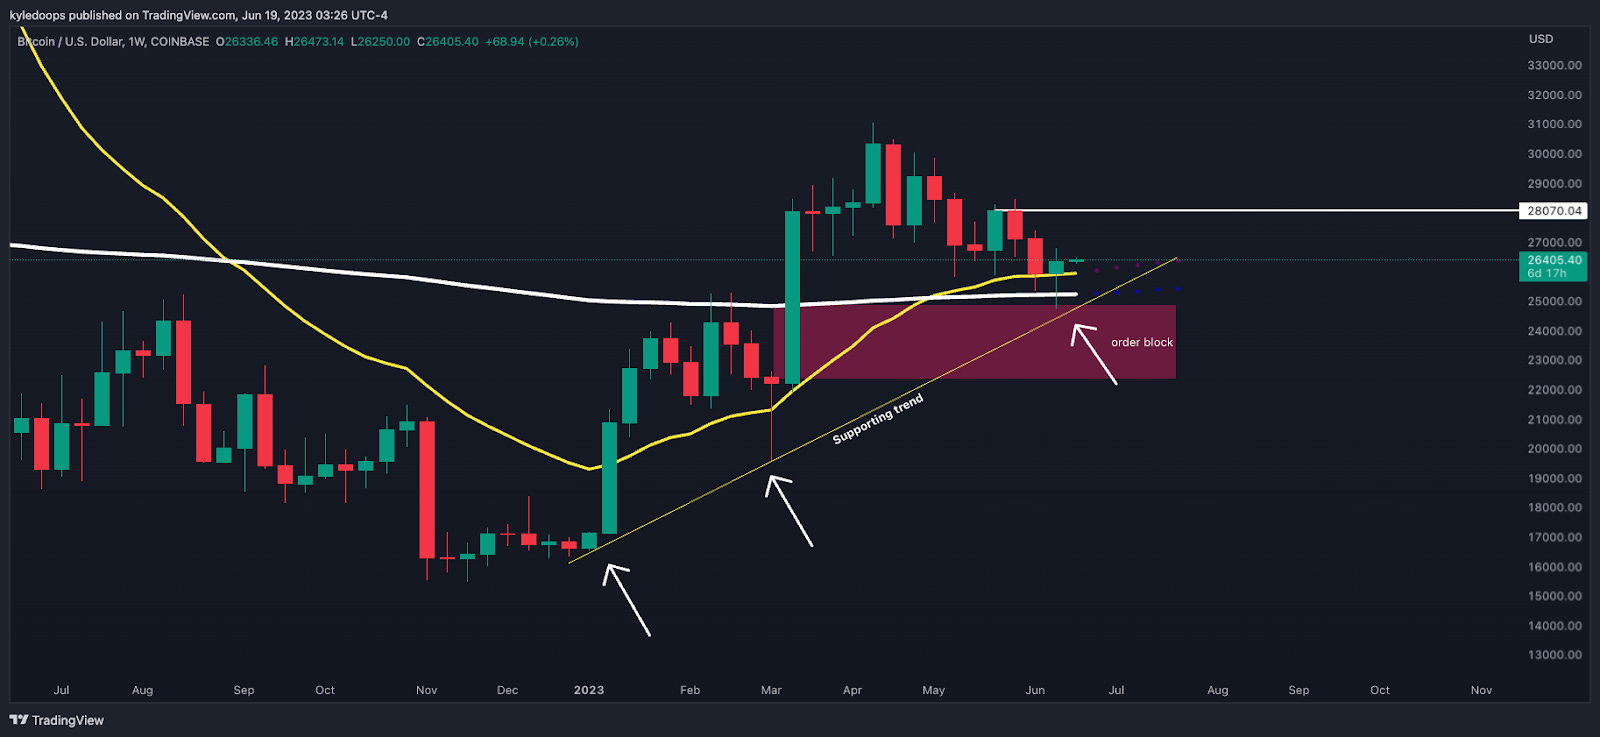
Chart #2 - Bitcoin (BTCUSD) 1-Week Chart
Chartist: Kyle
(For the chart screenshot, click here.)
Bitcoin closed the weekly chart above the 21 and 200 EMA yet again, indicating early signs that this could be another higher low on the larger time frame.
The price tagged the order block and subsequently rallied. Aggressive traders might choose to go long here, setting their stop loss below last week's wick low and beneath the diagonal supporting trend line.
On the other hand, conservative traders may prefer to wait for a weekly close above the $28,070 level.
𝗣𝗿𝗶𝗺𝗲 𝗫𝗕𝗧
Sign up for a new Trading Account on Prime XBT!
Receive a deposit bonus of up to $7,000 with promo code: KyleDoops

Sign up for a new Trading Account on Prime XBT!
Receive a deposit bonus of up to $7,000 with promo code: SheldonSniper
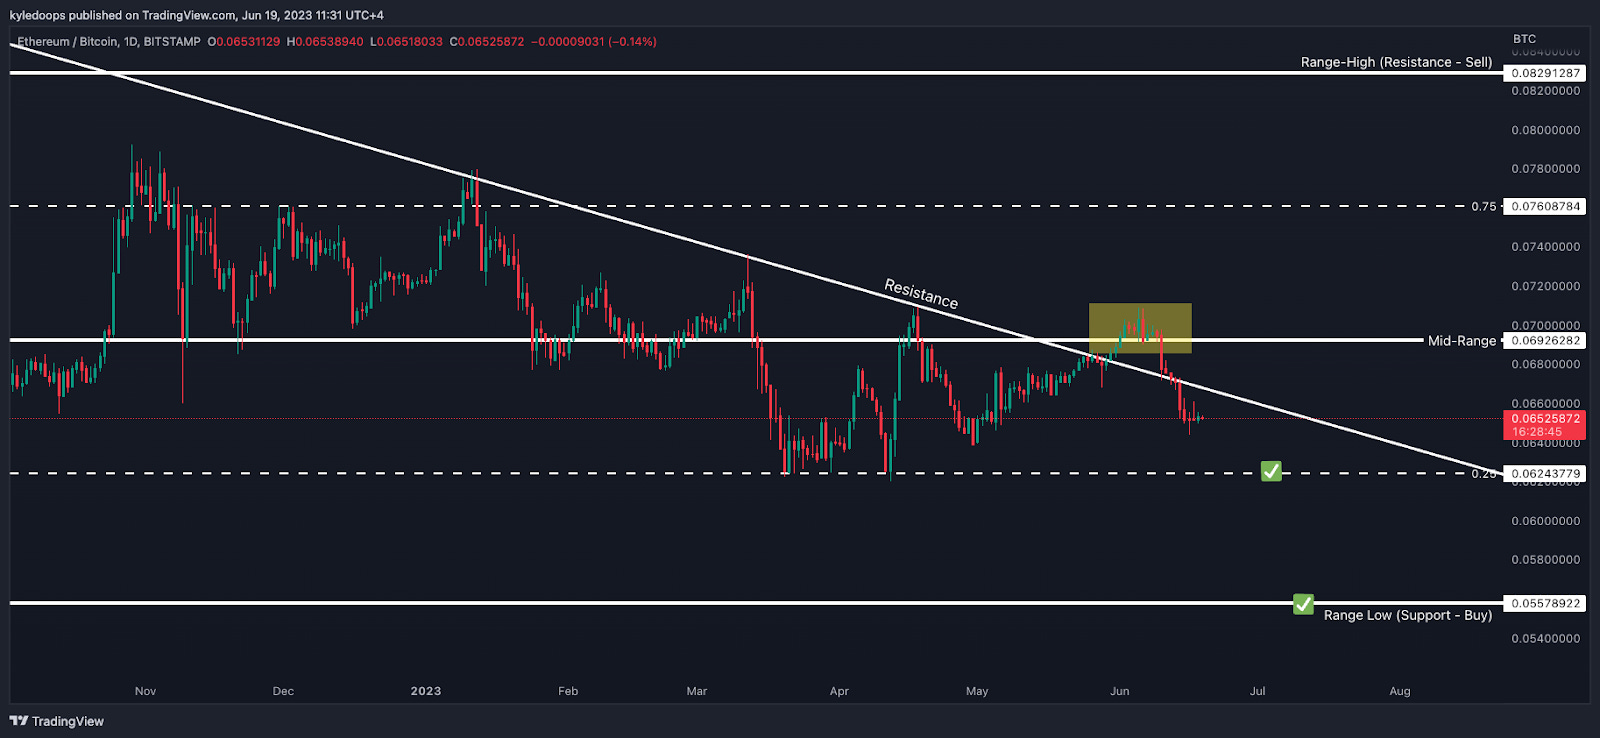
Chart #3 - Ethereum/Bitcoin (ETHBTC) 1-Day Chart
Chartist: Kyle
(For the chart screenshot, click here.)
The ETH/BTC ratio serves as a litmus test for the overall health of the altcoin market.
The ratio recently broke below the mid-range level and has sustained below the diagonal trend line. So long as it continues to hold there, the next support level is 0.06243.
Should that level fail to hold, the more significant support level below it is at 0.0557. That would be where we could see a greater bounce.
Claim your Bitget sign-up bonuses here (details below).
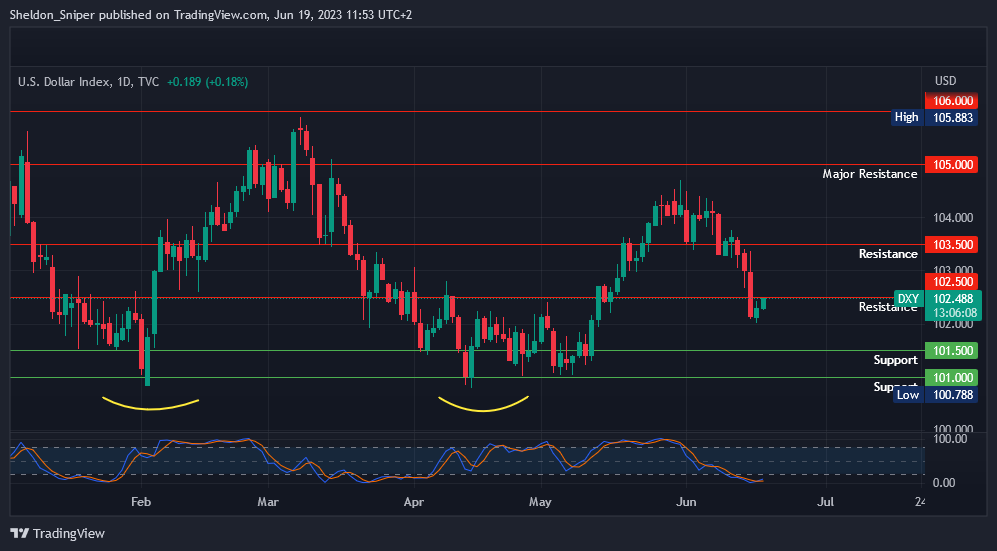
Chart #4 - U.S. Dollar (DXY) 1-Day Chart
Chartist: Sheldon
(For the chart screenshot, click here.)
Over the last three weeks, the DXY has been in a downtrend as cash flowed from the safety of the US Dollar into risk-on assets. During this period, the DXY retraced from 105.00 down to a point of support last week at 102.00.
Over the last two days, however, there has been a reversal back to the upside, with the DXY now testing its first resistance at 102.50. Should it break this level, the DXY could potentially reach the next resistance area at 103.50. Further upside from here will be bad for the risk-on markets.
But a rejection at this level could send the DXY trending back downwards, potentially towards the next support area at 101.00 - 101.50.
Claim your Bitget sign-up bonuses here (details below).
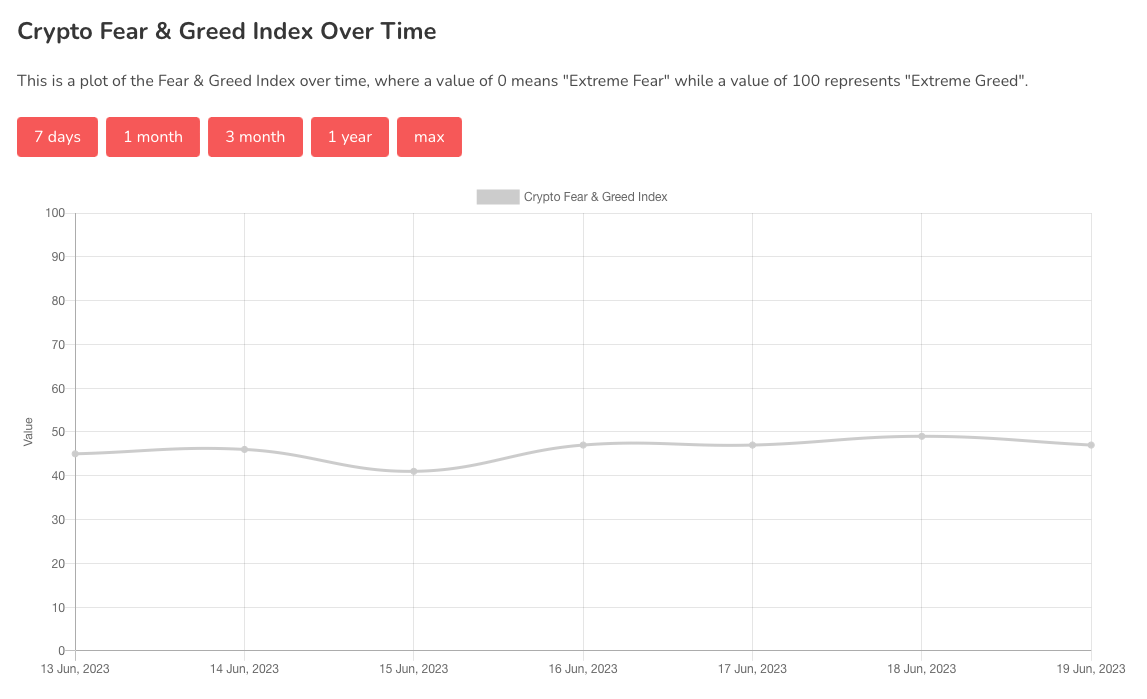
Chart #5 - Bitcoin Fear and Greed Index
The Bitcoin Fear and Greed Index is sitting at 47 today, Neutral.
The highest the index has been over the past seven days is 49, and the lowest is 41.
Banter’s Take
Bulls may gain a slight edge if the price holds above $26,000, with the next major resistance at $27,400. This could result in a liquidity grab at that level before breaking back into the range.
However, if the price falls below $26,000, bears could regain control.
If the price holds above $28,000, it's likely that a high timeframe higher low is in, indicating that bulls may take major control.
Stay safe my friends!
Go to our Crypto Banter Discord here where Sheldon and Kyle give updates on the charts and trades from The Daily Candle newsletter!