

📈📉 Bitcoin Could Spike UP to $37,000!
📈📉 Bitcoin Could Spike UP to $37,000!
The High Timeframe Structure is Changing!
Overview
Chart #1 - Crypto Total Market Cap (TOTAL) Daily
Chart #2 - Bitcoin (BTCUSD) Hourly
Chart #3 - U.S. Dollar (DXY) Weekly
Chart #4 - Theta Network (THETAUSDT) Daily
Chart #5 - Fear and Greed Index

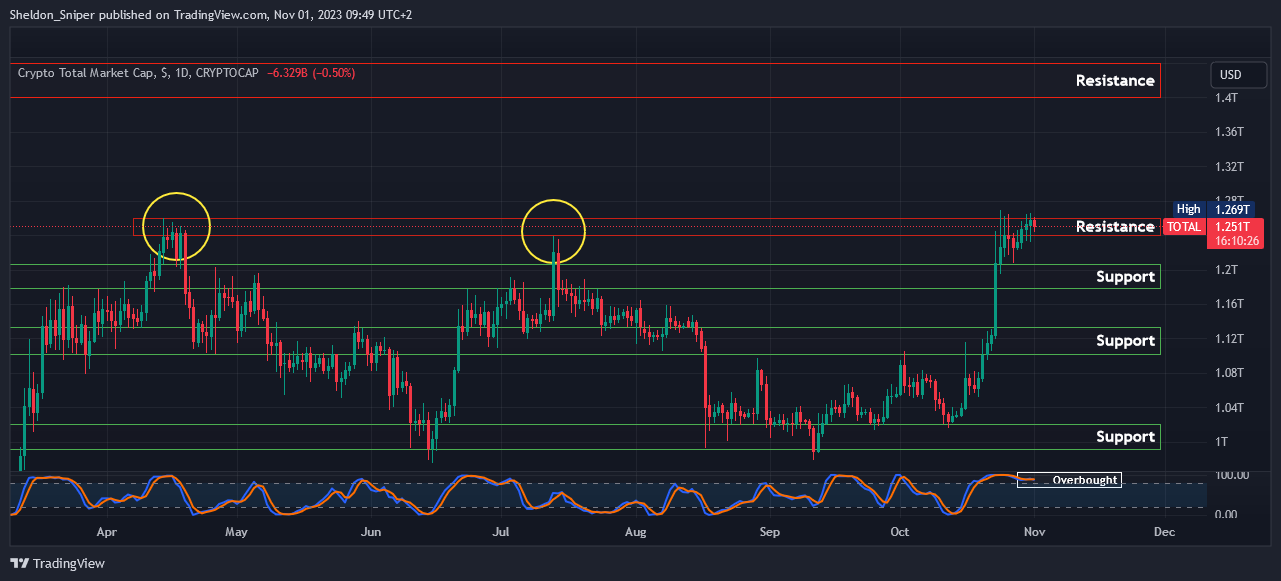
Chart #1 - Crypto Total Market Cap (TOTAL) Daily
Chartist: Sheldon
(For the chart screenshot, click here.)
The TOTAL continues to consolidate in the $1.245T - $1.265T area of resistance, the same area where it got rejected in April and July.
Over the last week, it also formed a rising wedge structure, which is normally bearish, with a 68% chance of a break to the downside.
The TOTAL is currently overbought on the daily timeframe, so there could be a pullback to $1.18T - $1.2T.
Sign-up and trade on Bybit today.
Exclusive $30,000 deposit rewards and bonuses up for grabs!
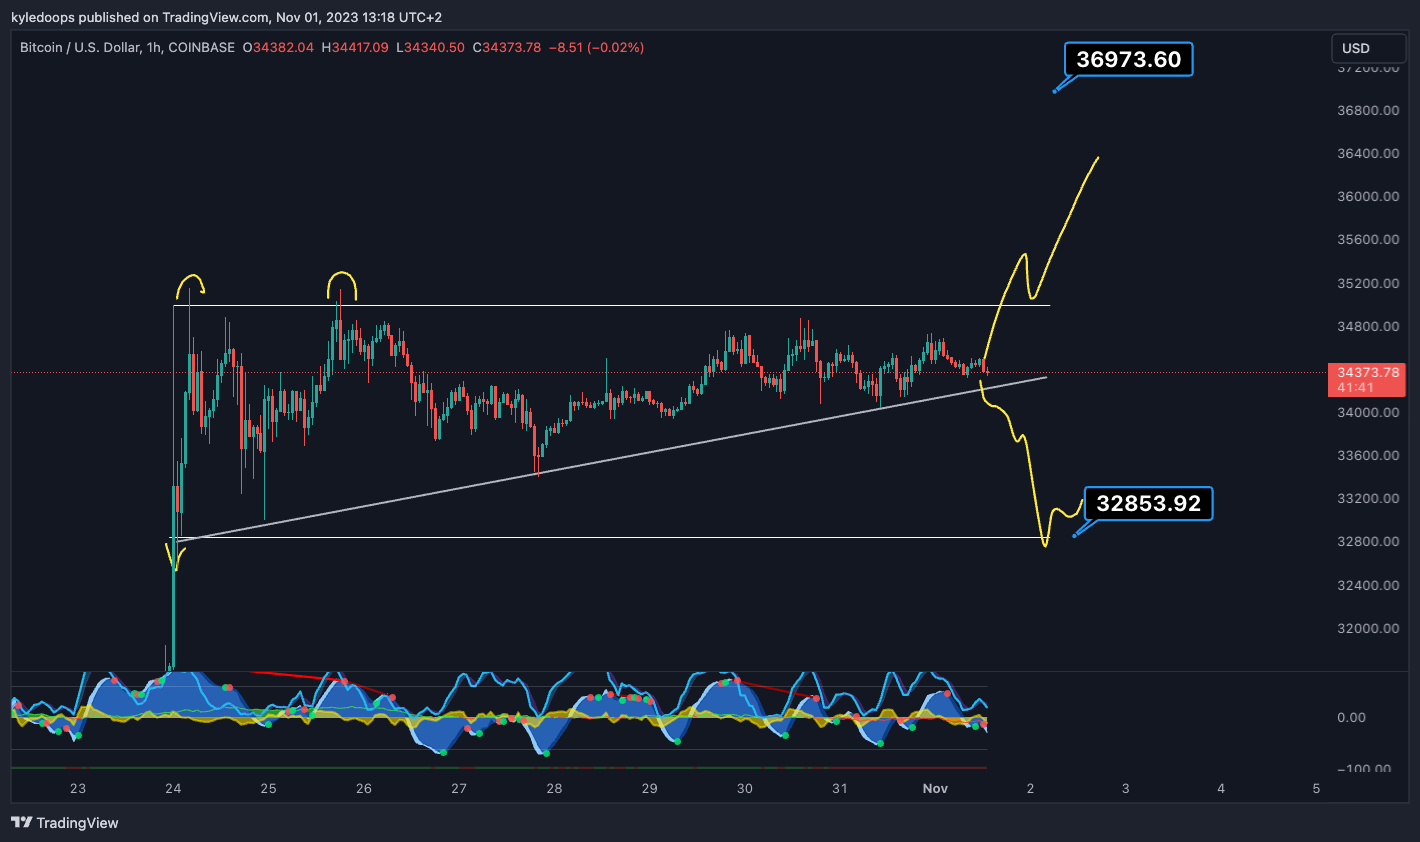
Chart #2 - Bitcoin (BTCUSD) Hourly
Chartist: Kyle
(For the chart screenshot, click here.)
These are the Bitcoin levels I'm focused on in the short term:
Bitcoin could spike up to almost $37,000 if it breaks out of this ascending triangle.
The alternative is a return to the range low at $32,853, which is a buying opportunity.
Claim your Bitget sign-up bonuses here (details below).

For more premium content like this, be sure to take advantage of our limited offer to the Whale Room Discord at 25% off for the first 3-months.
Apply the promo code “DOOPS”.
Limited to the first 50 people!
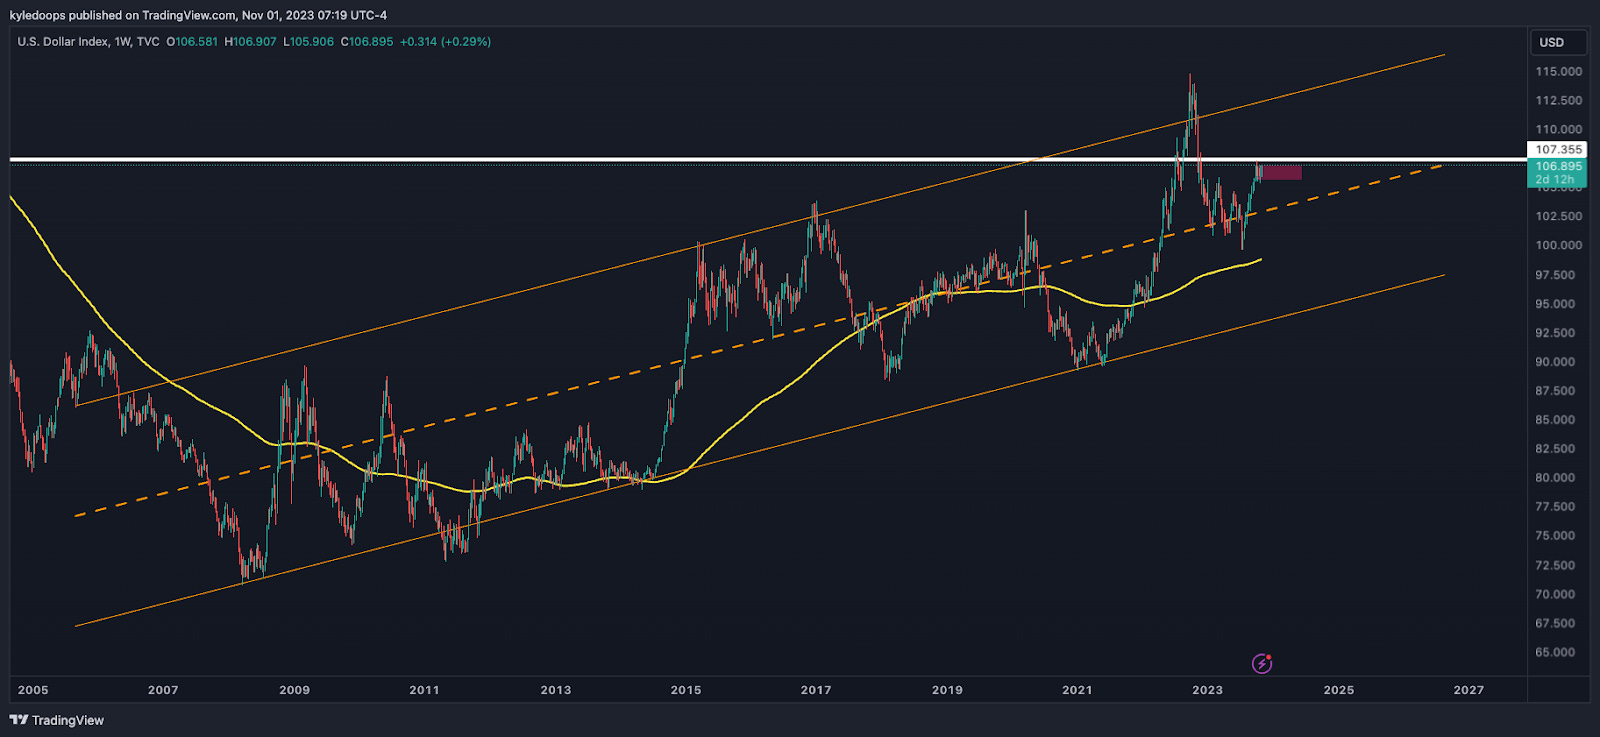
Chart #3 - U.S. Dollar (DXY) Weekly
Chartist: Kyle
(For the chart screenshot, click here.)
The market seems to have overlooked the DXY recently.
It is in a long-term bullish rising channel but is currently right at major resistance. The outcome at this crucial juncture for the market is uncertain. Will it breakout above the robust 107.35 resistance or face rejection?
The longer it consolidates at that level, the higher the chances of a breakout.
Claim your Bitget sign-up bonuses here (details below).
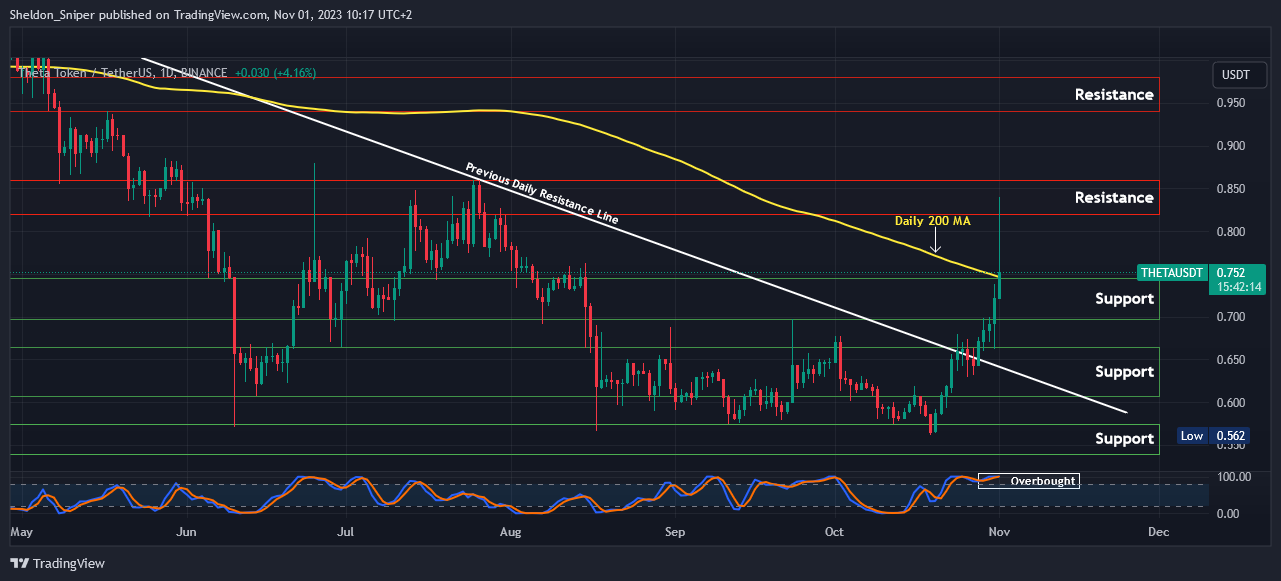
Chart #4 - Theta Network (THETAUSDT) Daily
Chartist: Sheldon
(For the chart screenshot, click here.)
This morning, THETA managed to break through the $0.75 level of resistance.
The price rallied almost 20%, going from around $0.72 up to $0.84, before finding resistance in the $0.825 - $0.86 area. Since then, the price has retraced and is currently trading at around $0.75, at the daily 200 Moving Average.
If it can find support, there is a chance of another move up to test $0.825 - $0.86!
Claim your Bitget sign-up bonuses here (details below).

🚀 Sniper School's New Cohort Begins November 7th!
Sniper School is a free 3-week trading course led by Sheldon. Dive deep into his strategies and insights to master the art of trading. Equip yourself with the skills to capitalize on market shifts and maximize your gains.
Limited Seats! With only 3,000 seats available, our waitlist fills up rapidly! Secure Your Seat Today!
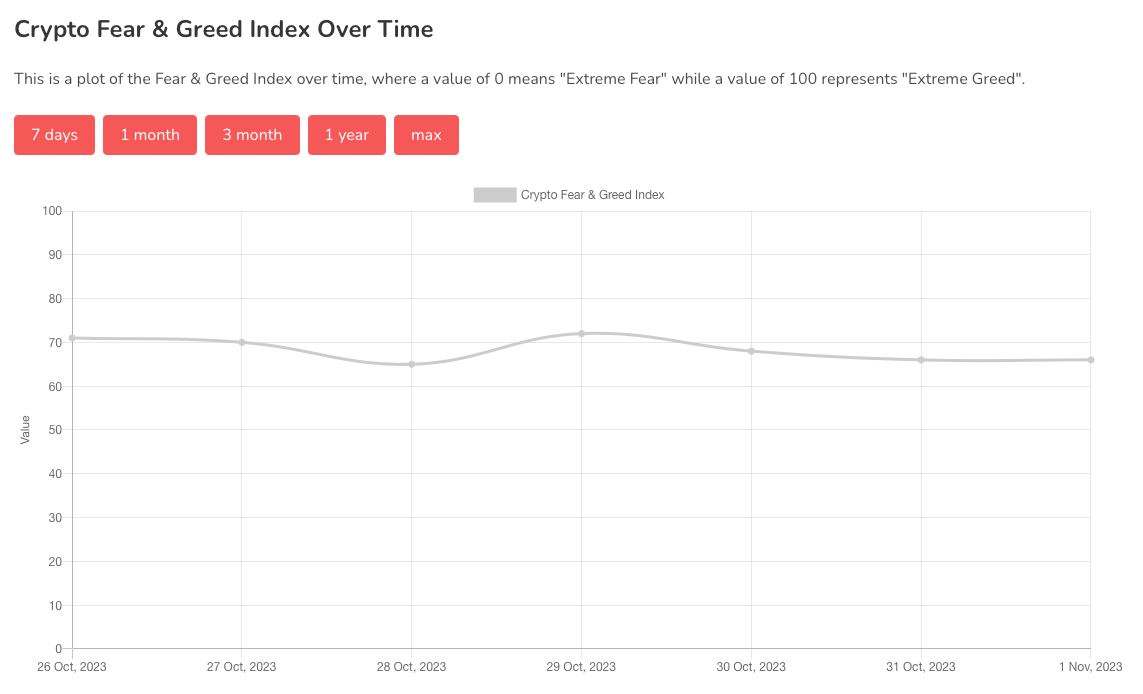
Chart #5 - Fear and Greed Index
The Fear and Greed Index is sitting at 66 today, indicating Greed.
The highest the index has been over the past seven days is 72, and the lowest is 65.
Banter’s Take
The high timeframe structure is changing, suggesting traders may soon shift profits from BTC to altcoins.
Monitor for higher lows and keep an eye on the stronger altcoins.
Stay safe my friends!
Go to our Crypto Banter Discord here where Sheldon and Kyle give updates on the charts and trades from The Daily Candle newsletter!