

📈📉 Bitcoin Eyes $25k! Will The DXY Cause A Pullback?
📈📉 Bitcoin Eyes $25k! Will The DXY Cause A Pullback?

Chart #1 - Solana (SOLUSDT) 1-Day Chart
Chartist: Sheldon

(For the chart screenshot, click here.)
Over the past week, SOL's price has been consolidating within a tight range, with support at approximately $20.00 and resistance at $21.50.
Should SOL successfully breach the $21.50 resistance, the next hurdle lies at the previous daily support line (now functioning as resistance) located around the $22.00 mark.
On the other hand, if the $20.00 support level is compromised, we could see SOL diving to the next support region between $17.50 - $19.00. This is a territory last visited by SOL in March.
𝗣𝗿𝗶𝗺𝗲 𝗫𝗕𝗧
Sign up for a new Trading Account on Prime XBT!
Receive a deposit bonus of up to $7,000 with promo code: SheldonSniper
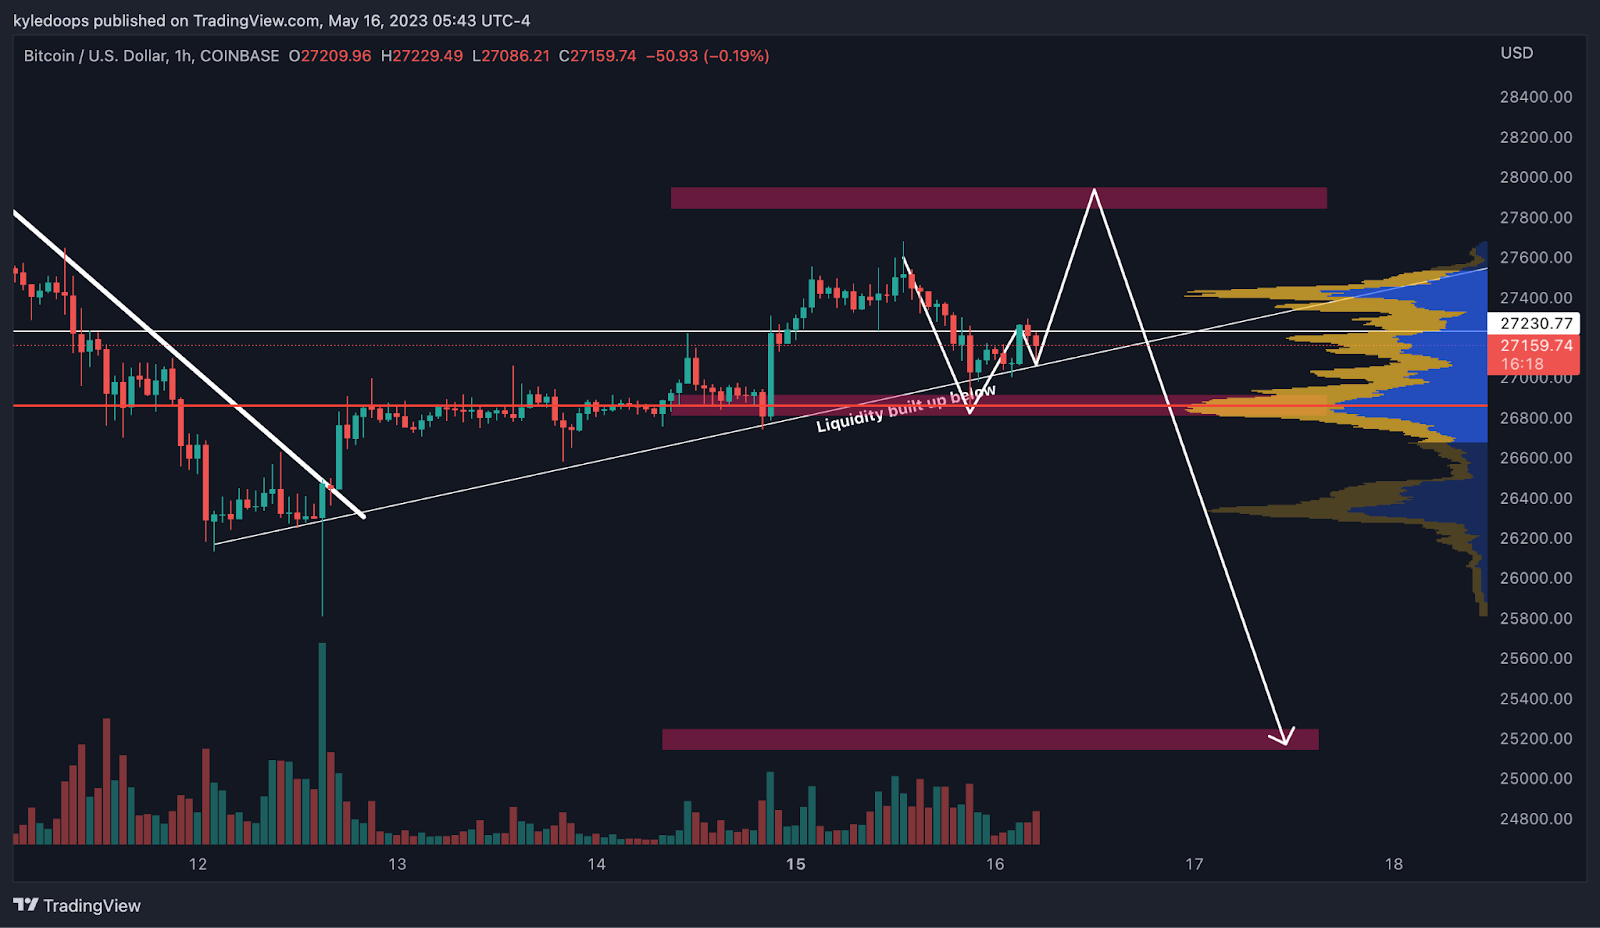
Chart #2 - Bitcoin (BTCUSD) 1-Hour Chart
Chartist: Kyle
(For the chart screenshot, click here.)
Bitcoin has been trailing a 1-hour diagonal supporting trend line.
Earlier today, it appeared as though it might break down, but it merely dipped into a liquidity pool to gather additional momentum. The pink horizontal boxes indicate where the liquidity pools reside. There's a chance that the price will initially rise, capturing the liquidity at $27,800. After that, it could drop again with considerable momentum, breaking the upward trend line and capturing the liquidity at $25,000.
Hitting the $25,000 mark would also signify a proper test of the previous range's breakout level.
𝗣𝗿𝗶𝗺𝗲 𝗫𝗕𝗧
Sign up for a new Trading Account on Prime XBT!
Receive a deposit bonus of up to $7,000 with promo code: KyleDoops

Chart #3 - U.S. Dollar (DXY) 1-Day Chart
Chartist: Kyle

(For the chart screenshot, click here.)
The DXY has pulled back slightly after establishing a double bottom at a significant weekly support level.
This minor pullback is approaching a support level at 102.3. If that level holds, anticipate a rebound of the dollar, subsequently continuing its upward trajectory towards the 103.5 mark, which is labeled as T1 on the chart.
Claim your Bitget sign-up bonuses here (details below).
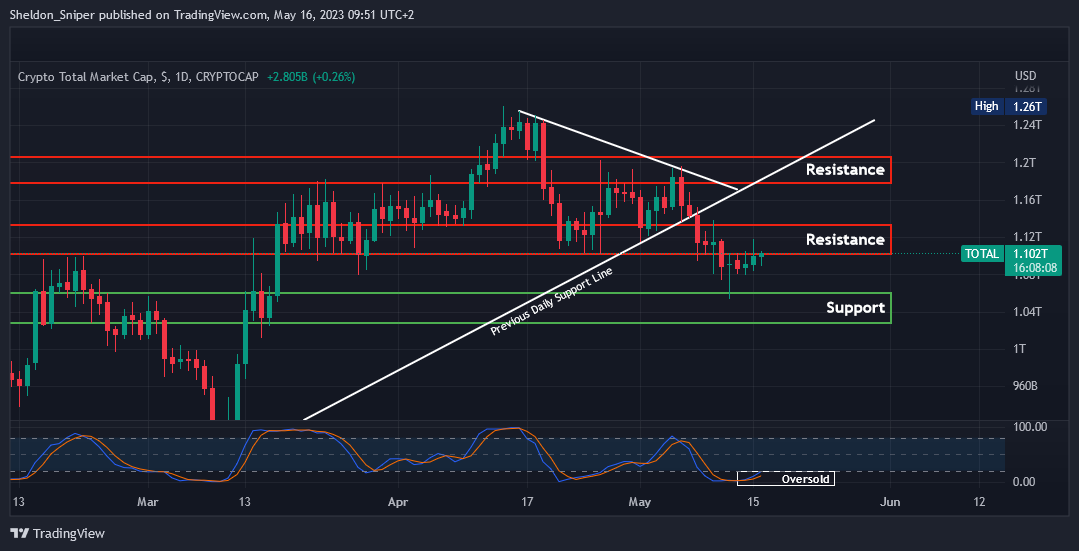
Chart #4 - TOTAL 1-Day Chart
Chartist: Sheldon
(For the chart screenshot, click here.)
Last Friday, the TOTAL dipped to test the support at the $1.05T mark. However, the bulls made a timely intervention, pushing the market upwards.
Currently, it stands at $1.10T, a position where it's encountering significant resistance. But, given that the daily STOCH RSI is oversold, there's potential for the market to ascend from here.
If this upward momentum persists, we could see the market breaching the resistance zone of $1.10T - $1.14T and possibly even test the next resistance level between $1.18T - $1.20T. But, if the TOTAL faces a rejection at the current resistance of $1.10T, it could descend to the next support level between $1.03T - $1.05T.
Claim your Bitget sign-up bonuses here (details below).
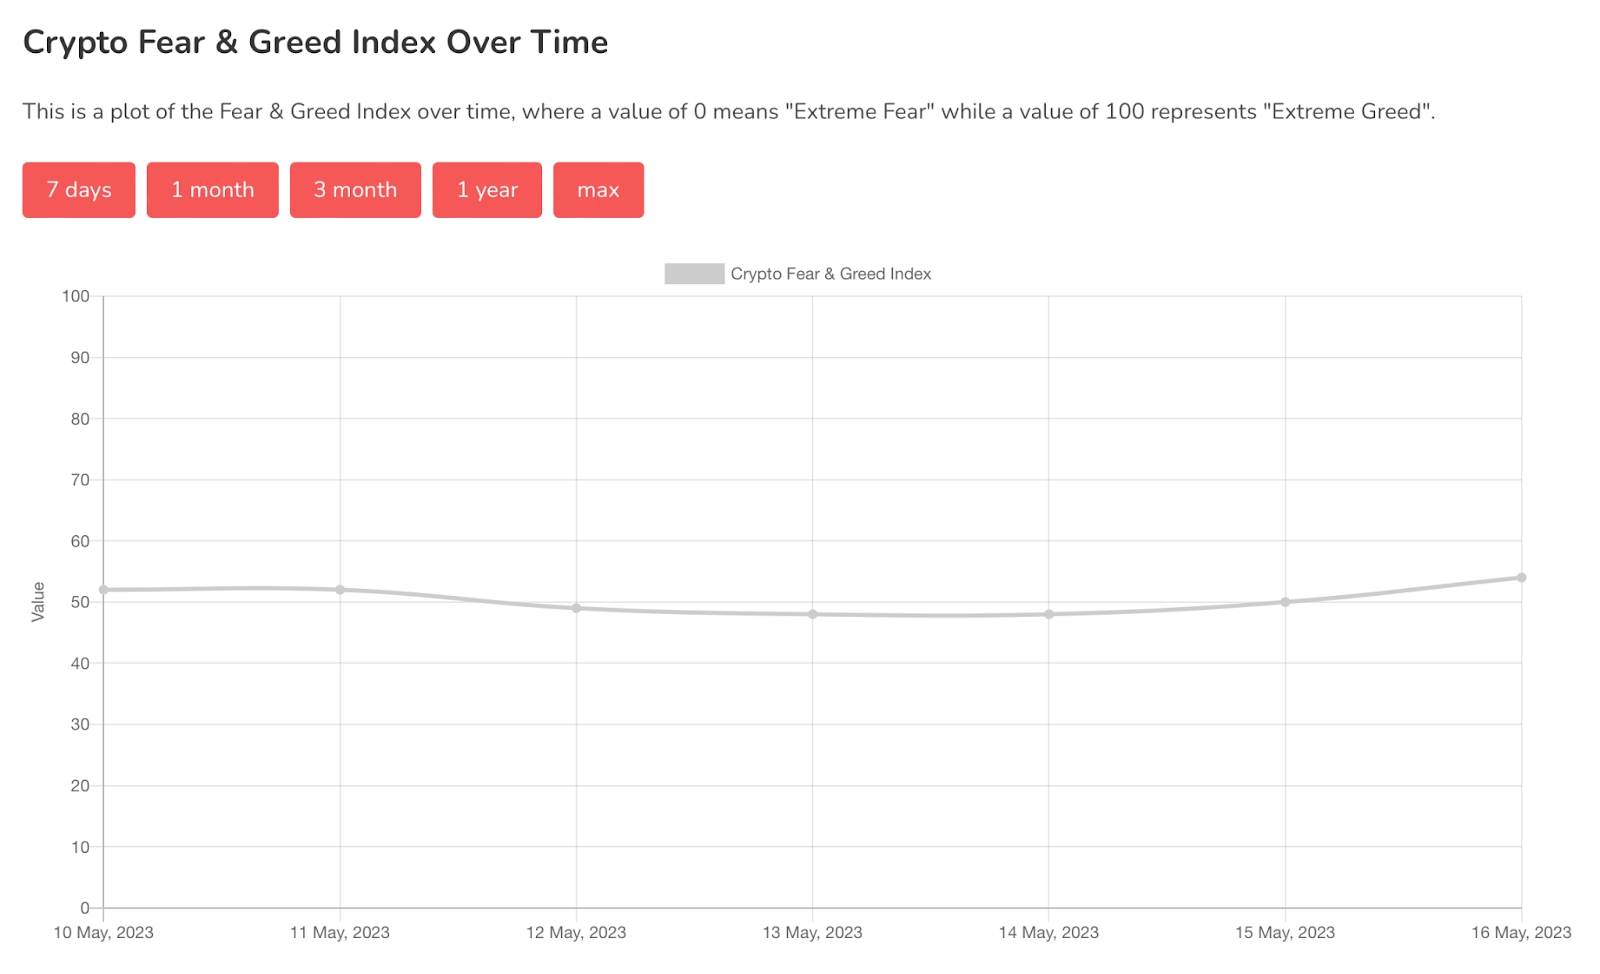
Chart #5 - Bitcoin Fear and Greed Index
The Bitcoin Fear and Greed Index is sitting at 54 today, Neutral.
The highest the index has been over the past seven days is 54, and the lowest is 48.
Banter’s Take
If the dollar holds its support and keeps pushing higher, then we will likely see crypto pullback a little more. The downside target for bitcoin is $25,000 which would be a textbook-perfect retest of the prior range high where price broke out of.
Stay safe my friends!
Go to our Crypto Banter Discord here where Sheldon and Kyle give updates on the charts and trades from The Daily Candle newsletter!