

📈📉 Bitcoin Freefall To $22,500 If It Loses This Level!
📈📉 Bitcoin Freefall To $22,500 If It Loses This Level!

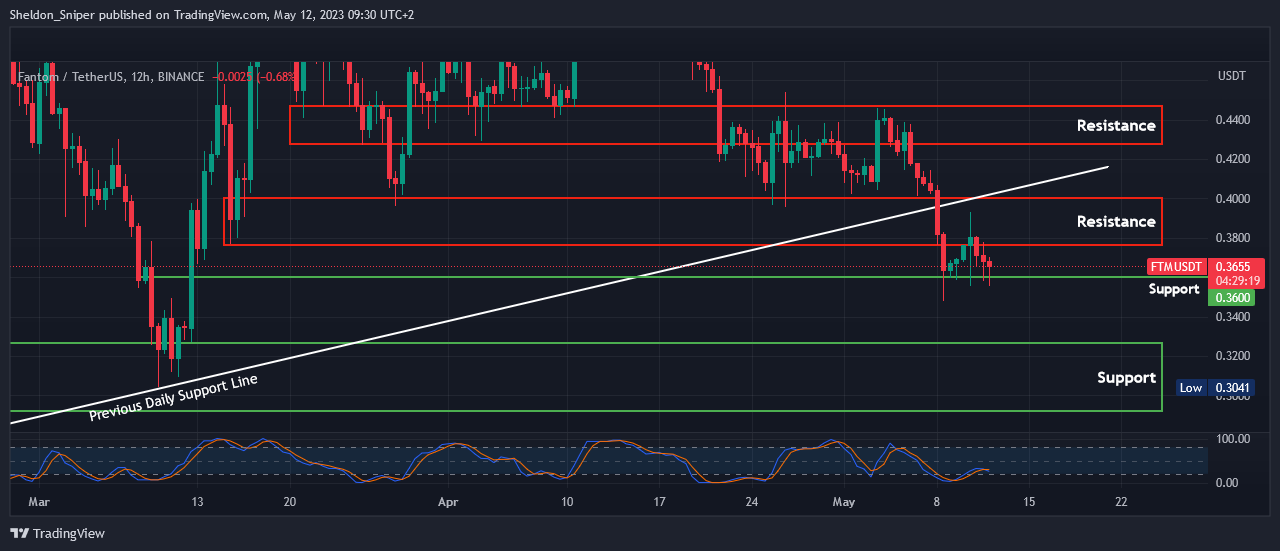
Chart #1 - Fantom (FTMUSDT) 12-Hour Chart
Chartist: Sheldon
(For the chart screenshot, click here.)
FTM has breached its daily support line that traces back to the start of January.
It has now found new support at approximately $0.36. Meanwhile, BTC's price is nearing an oversold state, hinting at a potential reversal. If that happens, it could stimulate FTM to climb once again, potentially testing the next resistance between $0.38 - $0.40. It could also revisit the previous daily support line, which is currently functioning as a resistance level.
However, if FTM drops below the $0.36 support level, it will test the next substantial support zone in the range of $0.2950 - $0.3250.
𝗣𝗿𝗶𝗺𝗲 𝗫𝗕𝗧
Sign up for a new Trading Account on Prime XBT!
Receive a deposit bonus of up to $7,000 with promo code: SheldonSniper
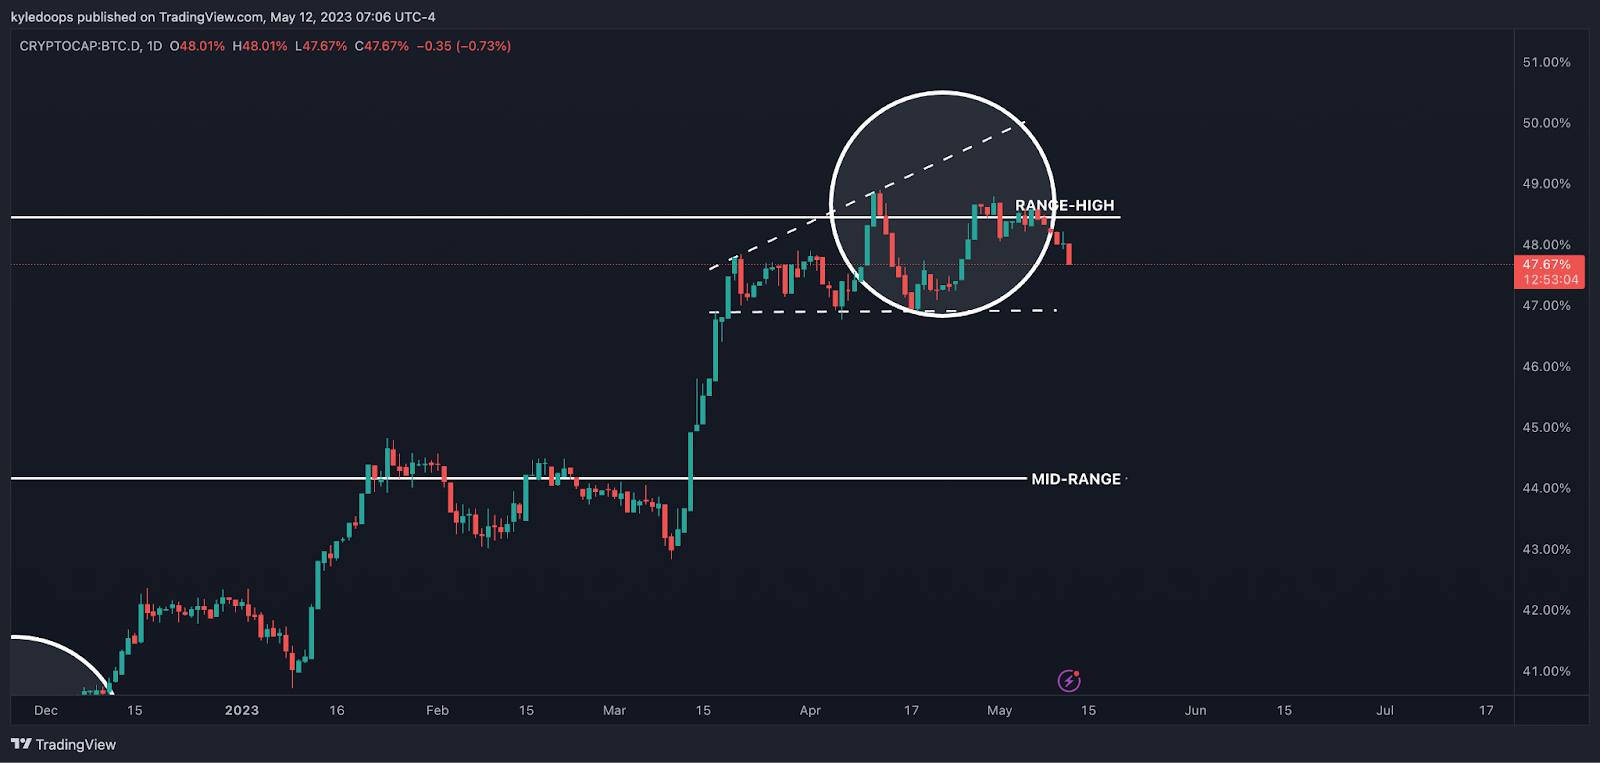
Chart #2 - Bitcoin Dominance (BTC.D) 1-Day Chart
Chartist: Kyle
(For the chart screenshot, click here.)
The decline in BTC Dominance paints an intriguing picture.
Essentially bitcoin is experiencing a more significant sell-off compared to altcoins. That’s noteworthy given that altcoins are reaching new lows, and it signals that if bitcoin manages to maintain its support at the $25,500 mark and subsequently rebounds, the bounce-back on altcoins could be even more dramatic!
𝗣𝗿𝗶𝗺𝗲 𝗫𝗕𝗧
Sign up for a new Trading Account on Prime XBT!
Receive a deposit bonus of up to $7,000 with promo code: KyleDoops

➡️ ENTER THE COMPETITION HERE ⬅️
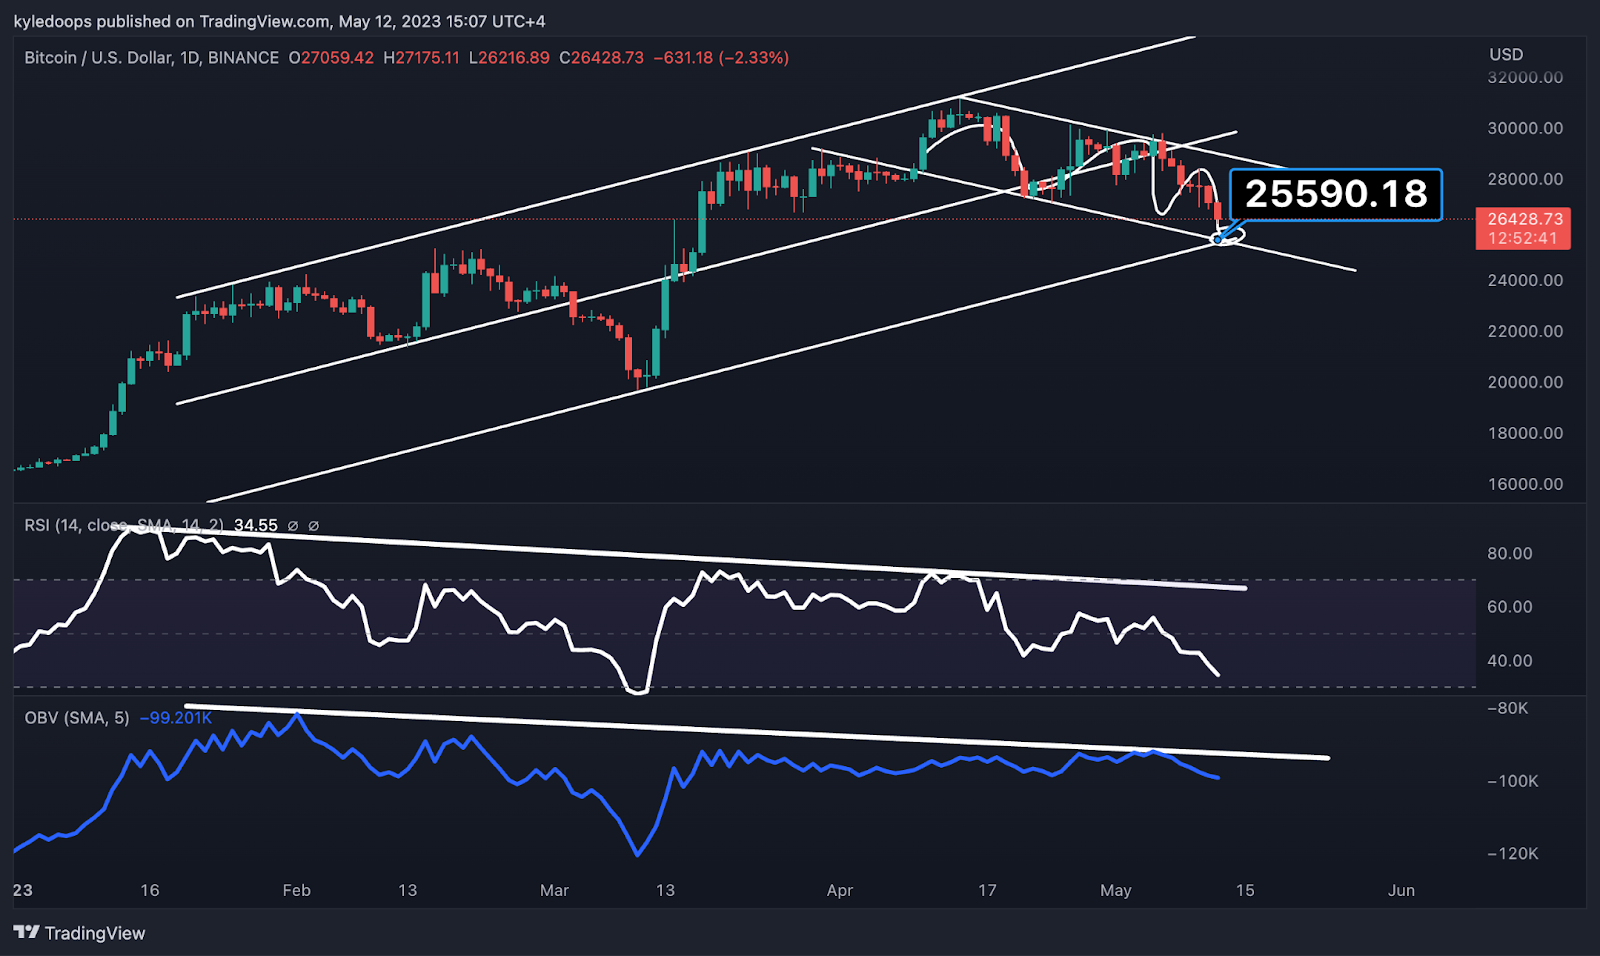
Chart #3 - Bitcoin (BTCUSD) 1-Day Chart
Chartist: Kyle
(For the chart screenshot, click here.)
BTC continues to sell-off, with downward pressure persisting in the RSI and the OBV also exhibiting a bearish angle. This indicates a potential further decline in prices.
The ultimate confluence for support comes in at the $25,500 level. This level aligns with key moving averages (MAs) and exponential moving averages (EMAs) on longer timeframes (though these are not visible in the chart above). It's also where the bottom lines of both the rising and falling channels coincide.
Basically, the $25,500 level is crucial. If that level fails, the price could tumble down towards $22,500. On the other hand, if it holds, we should get a bounce.
Claim your Bitget sign-up bonuses here (details below).
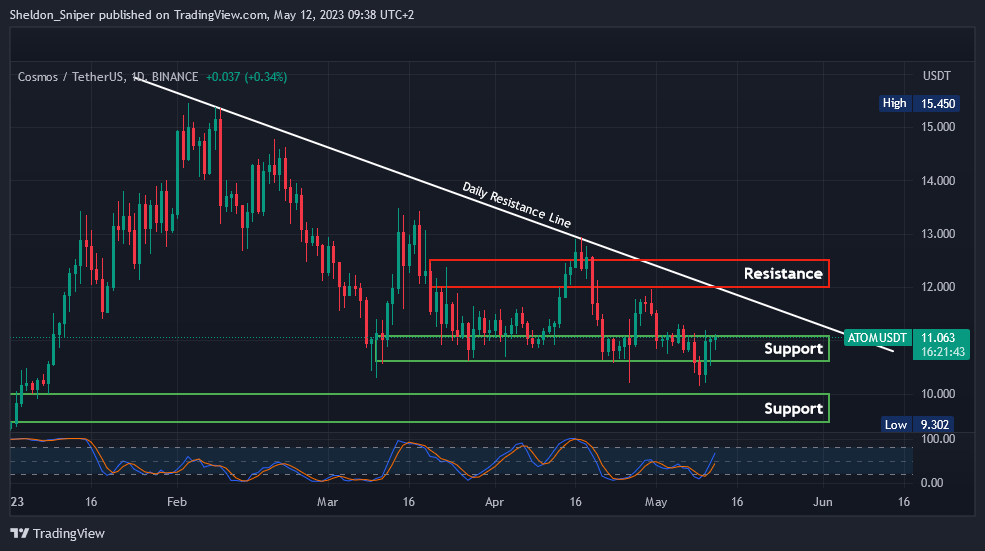
Chart #4 - Cosmos Hub (ATOMUSDT) 1-Day Chart
Chartist: Sheldon
(For the chart screenshot, click here.)
In the past two months, ATOM has maintained a robust support area between $10.80 and $11.00.
With BTC almost oversold on the daily chart, a bounce back could be imminent. In such a scenario, ATOM is likely to follow suit, potentially testing the resistance around $12.00 - $12.50. This area coincides with the descending daily resistance line originating from February.
However, if ATOM breaks through the current support area of $10.80, it may be a bearish signal. In this case, the next support level to watch would be slightly lower, within the range of $9.50 - $10.00.
Claim your Bitget sign-up bonuses here (details below).
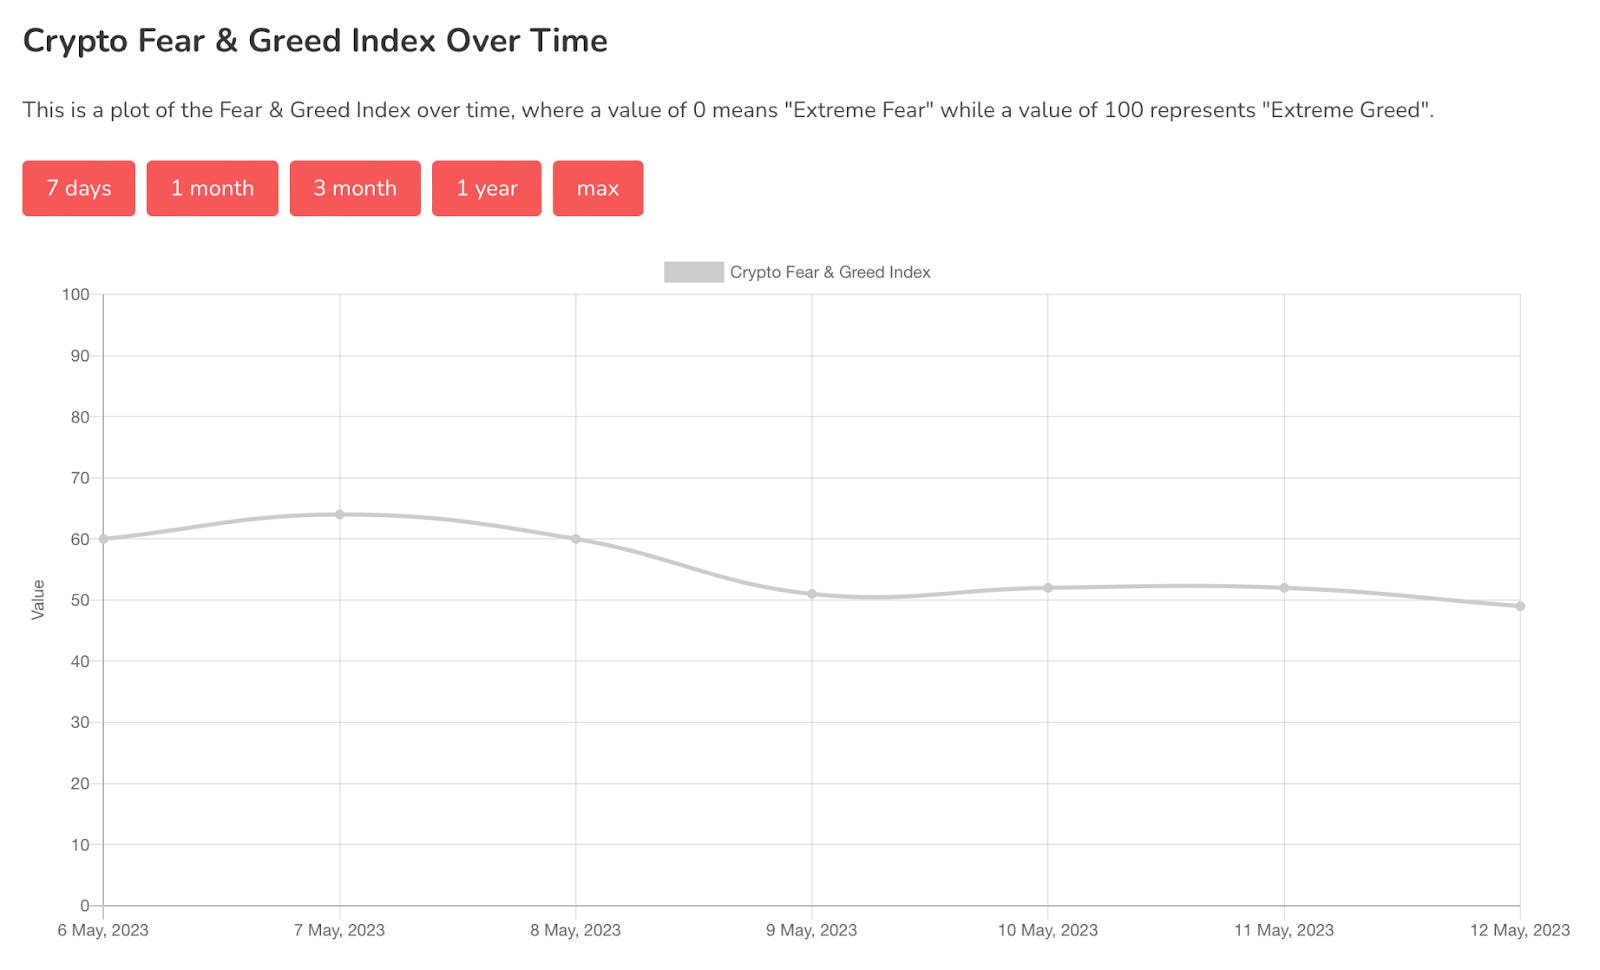
Chart #5 - Bitcoin Fear and Greed Index
The Bitcoin Fear and Greed Index is sitting at 49 today, Neutral.
The highest the index has been over the past seven days is 64, and the lowest is 49.
Banter’s Take
The sell-off was pretty text book and should not have caught too many by surprise.
If it continues to trade with text book fashion, then $25,500 should be where bitcoin bounces. But when it comes to crypto, always prepare for the unexpected.
Stay safe my friends!
Go to our Crypto Banter Discord here where Sheldon and Kyle give updates on the charts and trades from The Daily Candle newsletter!
Today’s winning UIDs:
Bybit winner - 26903169
Bitget winner - 7941660396
Competition Leaderboard
