

📈📉 Bitcoin heading down again! Can SOL pass $30?
📈📉 Bitcoin heading down again! Can SOL pass $30?

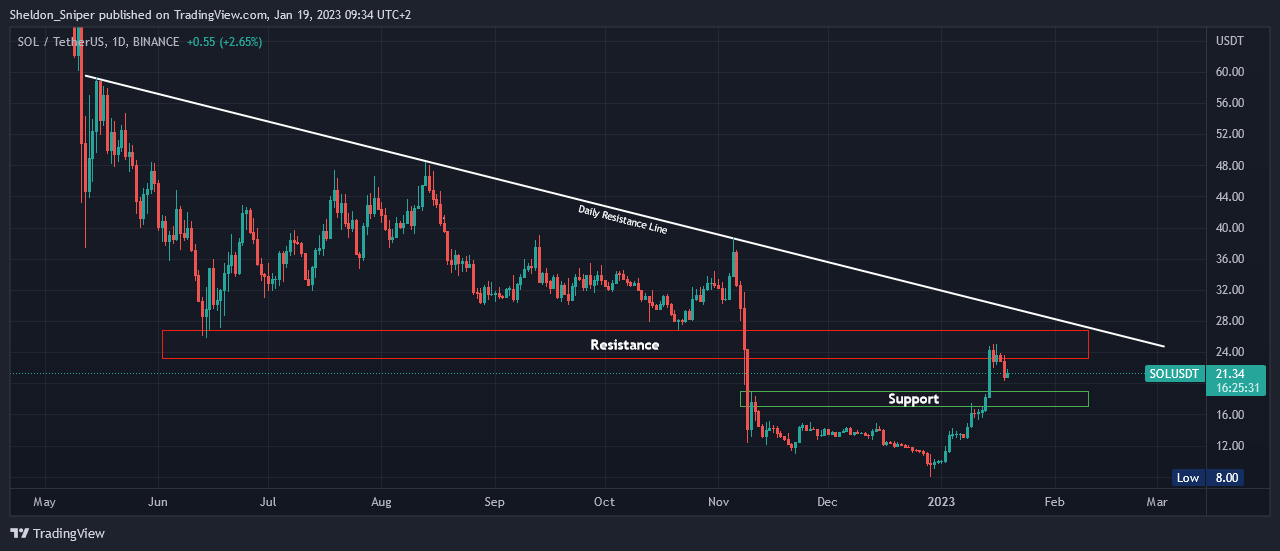
Chart #1 - Solana (SOLUSDT) 1-Day Chart
Chartist: Sheldon
(For the chart screenshot, click here.)
Towards the end of last year, many traders were writing off SOL, but it saw a massive run in the last three weeks, moving from $8 to just under $25.
SOL is not dead and possibly has more short-time upside coming after the current correction - which could take the price down to test the next support area between $18 - $20.
If SOL finds support at that level, it could set the price up to test the next resistance zone between $28 - $30. But the daily descending resistance line from May 2022 intersects there and will add additional resistance.
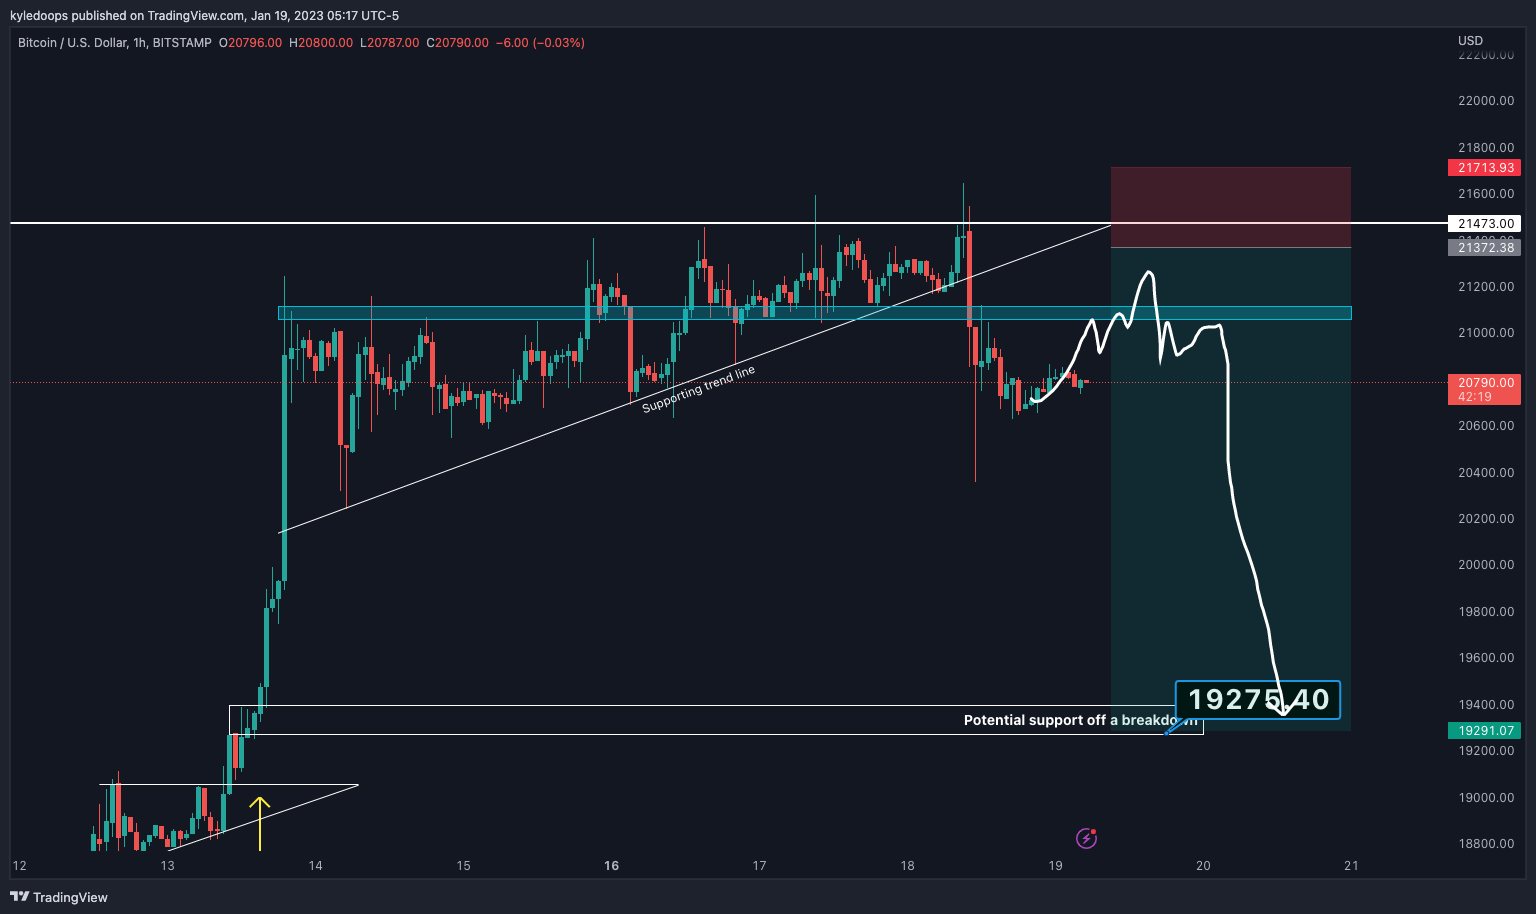
Chart #2 - Bitcoin (BTCUSD) 1-Hour Chart
Chartist: Kyle
(For the chart screenshot, click here.)
Following on from yesterday's trade, the market structure on the low time frame seems to have broken to the downside, and consequently, my short trade got activated and is now in profit.
Look at how the price initially rejected the $21,050 - $21,120 range but then broke through and tried to flip it as support. But subsequently, BTC's inability to close above $21,470 meant it fell and lost the blue box.
So, I'm looking for a push back up into that zone (with a possible deviation above) before it goes back under, continuing the bearish trade.
My final take profit level would be at $19,275.
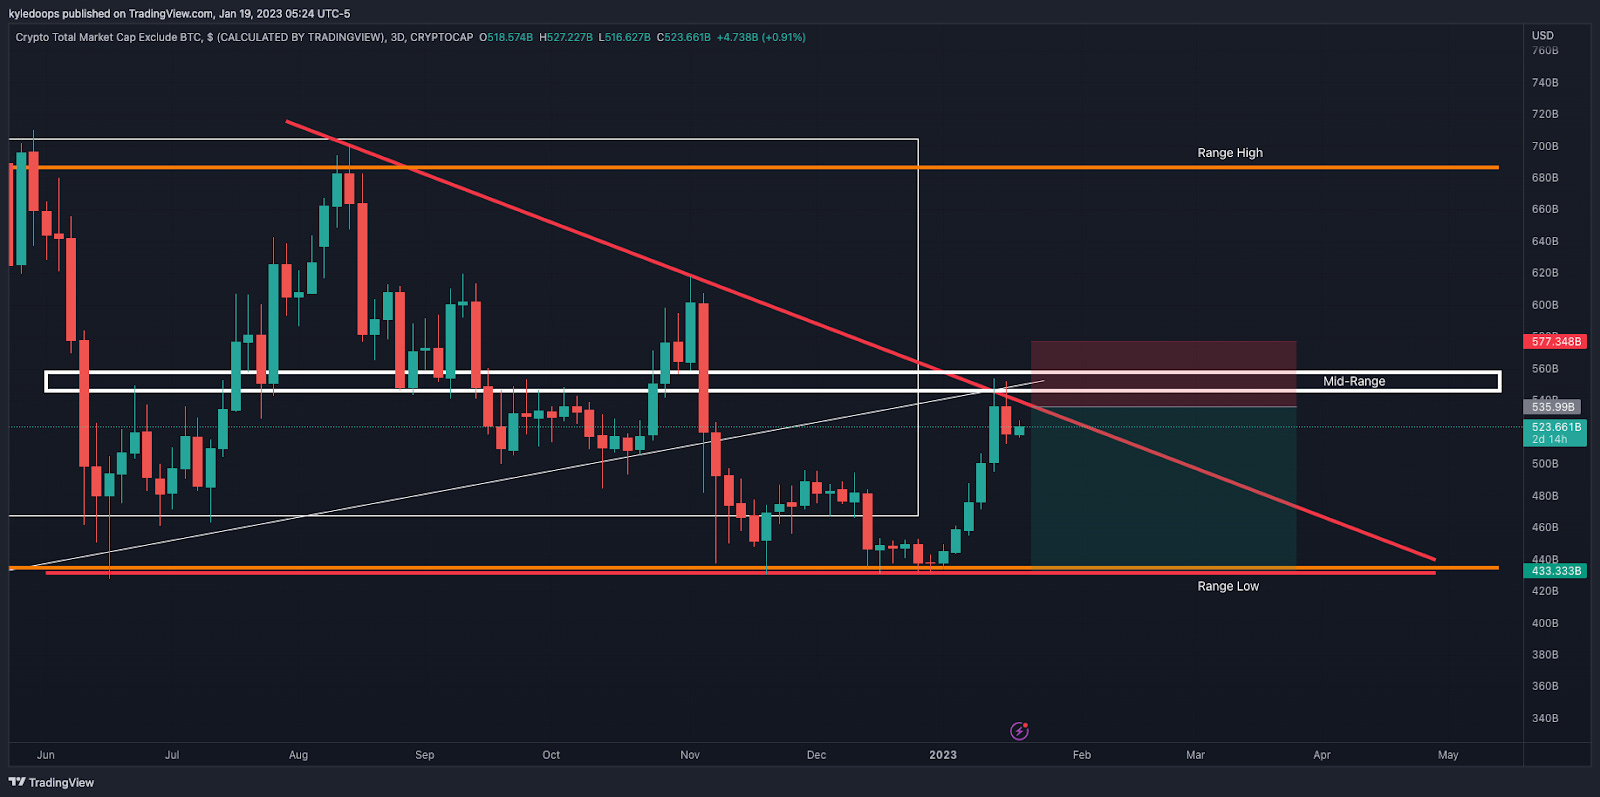
Chart #3 - Crypto Total Market Cap excluding BTC (TOTAL2) 3-Day Chart
Chartist: Kyle
(For the chart screenshot, click here.)
The TOTAL2 came right into resistance at the mid-range and got rejected.
The mid-range was tough to cross due to the diagonal resistance line (red down-sloping trend line) crossing there.
If a local high gets confirmed, the range low at $433.33B could be our next target.
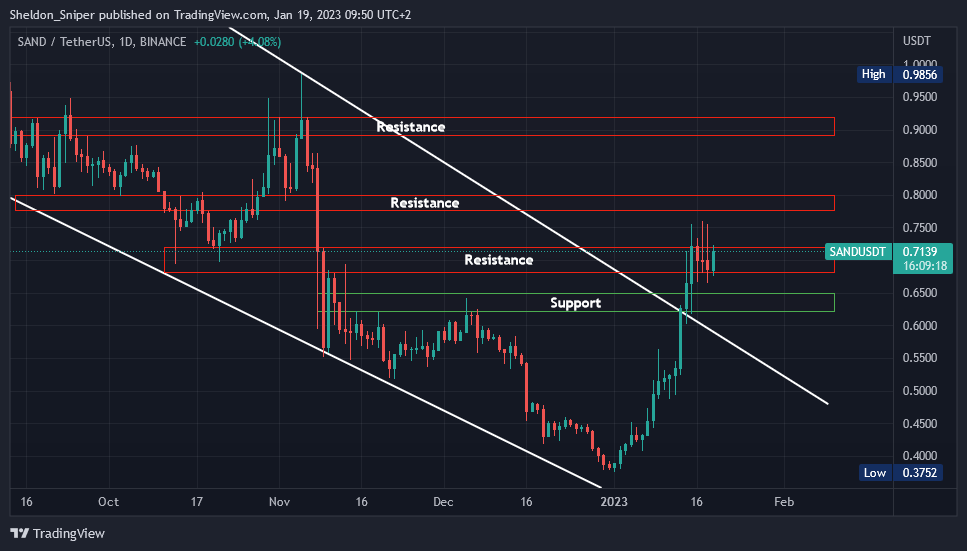
Chart #4 - The Sandbox (SANDUSDT) 1-Day Chart
Chartist: Sheldon
(For the chart screenshot, click here.)
SAND has been one of the best-performing coins this year, increasing from under $0.38 to just over $0.70.
The market has started a correction, and SAND may retrace to test $0.65 (support). Alternatively, it could potentially trade sideways around the $0.70 level (resistance), setting it up to test the resistance levels of $0.80 and $0.90.
Metaverse and gaming have been two of the star-performing categories during the past three weeks, and I don't think the rally is over just yet.
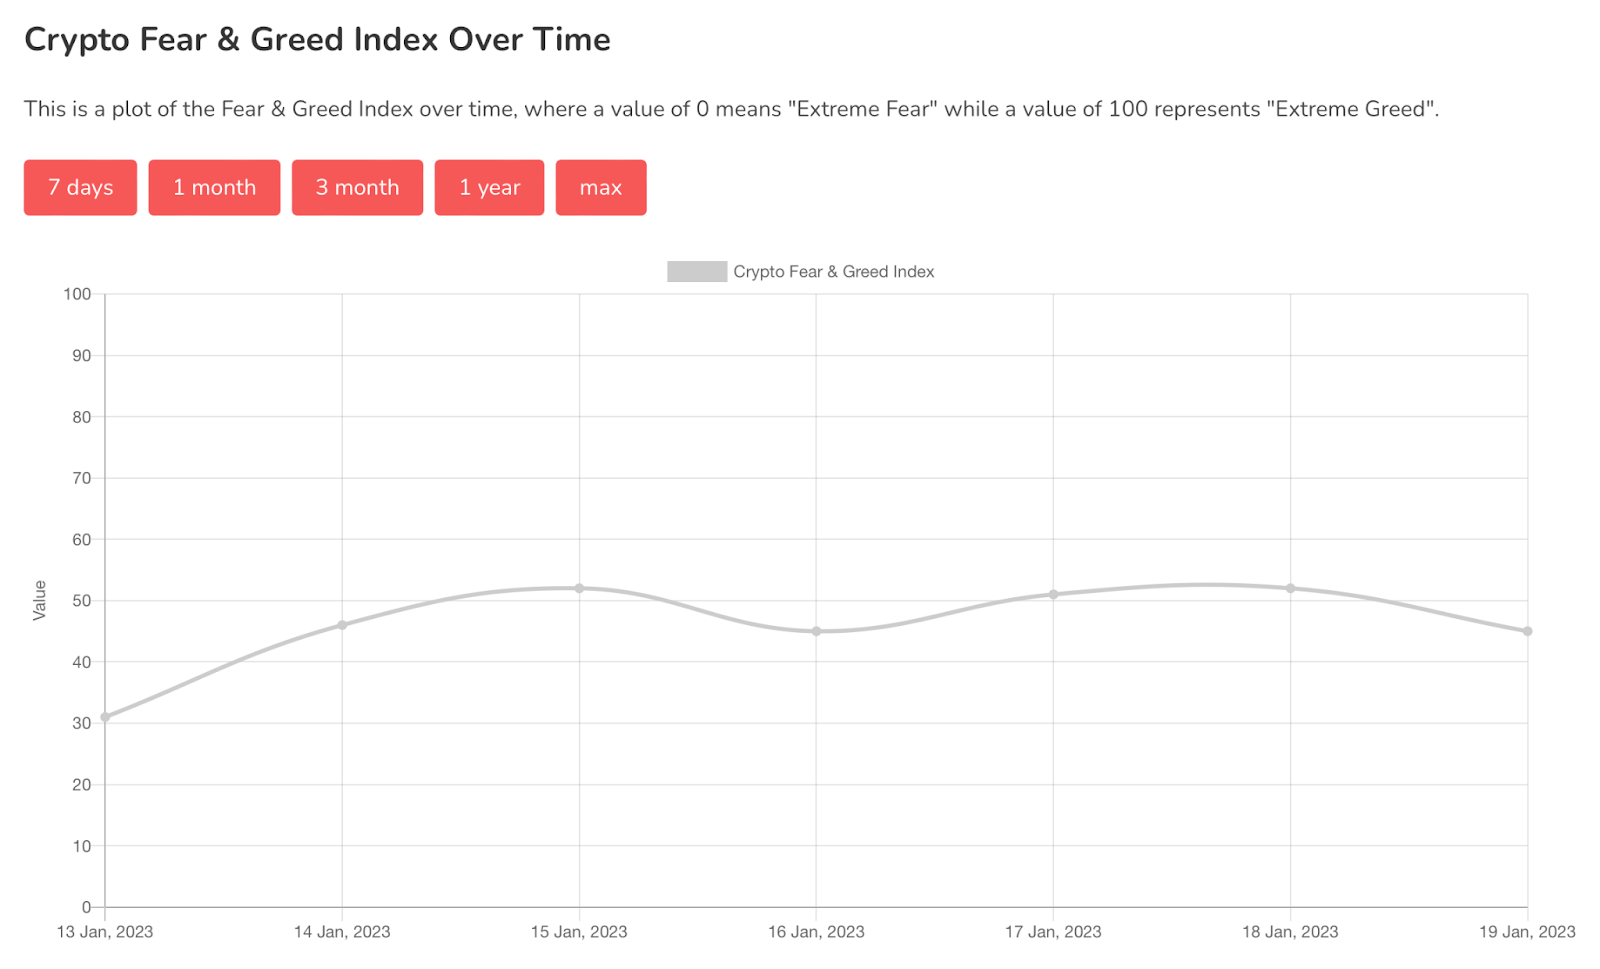
Chart #5 - Bitcoin Fear and Greed Index
The Bitcoin Fear and Greed Index is sitting at 45 today, indicating Fear.
The highest the index has been over the past seven days is 52, and the lowest is 31.
Overall Market Sentiment (Banter’s Take)
Many crypto assets are currently rejecting their mid-range levels. We also saw a big rejection from the stock market. Today may bring a downside continuation, so the bias remains slightly bearish.
Bitcoin will likely catch a bid at $19,200 - or perhaps higher due to sidelined FOMO participants. A reclaim of the mid-range would activate many traders to go long.
Stay safe my friends!