

📈📉 Bitcoin heading to $34k but faces massive sell-wall! Critical levels inside!
📈📉 Bitcoin heading to $34k but faces massive sell-wall! Critical levels inside!

Bitget winner - 3058560503
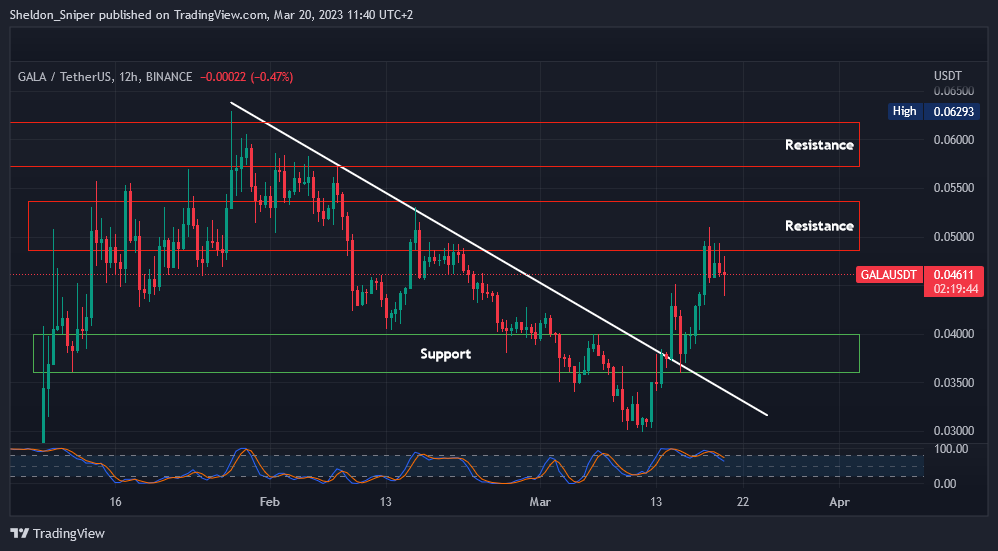
Chart #1 - GALA (GALAUSDT) 12-Hour Chart
Chartist: Sheldon
(For the chart screenshot, click here.)
GALA has had an impressive week, increasing 66% from $0.03 to $0.05.
If it keeps on with this momentum and breaches the resistance found at $0.05, it could reach its January high of $0.06.
But the indicators on the higher time frames are showing that GALA is now overbought. Combine that with the fact that it is at resistance, and it's likely that it gets rejected here and goes down to support found around $0.036 - $0.04.
𝗣𝗿𝗶𝗺𝗲 𝗫𝗕𝗧
Sign up for a new Trading Account on Prime XBT!
Receive a deposit bonus of up to $7,000 with promo code: SheldonSniper
Chart #2 - Ethereum (ETHUSD) 1-Day Chart
Chartist: Kyle

(For the chart screenshot, click here.)
ETH has reclaimed a key level on its daily chart at $1,700 - its range high. Now, as long as it can hold it, traders can play the chart level by level. The next level to look out for is $2,000.
As long as bitcoin continues consolidating sideways, it is highly likely that ETH gradually makes its way up to that $2,000 level in the coming days.
𝗣𝗿𝗶𝗺𝗲 𝗫𝗕𝗧
Sign up for a new Trading Account on Prime XBT!
Receive a deposit bonus of up to $7,000 with promo code: KyleDoops

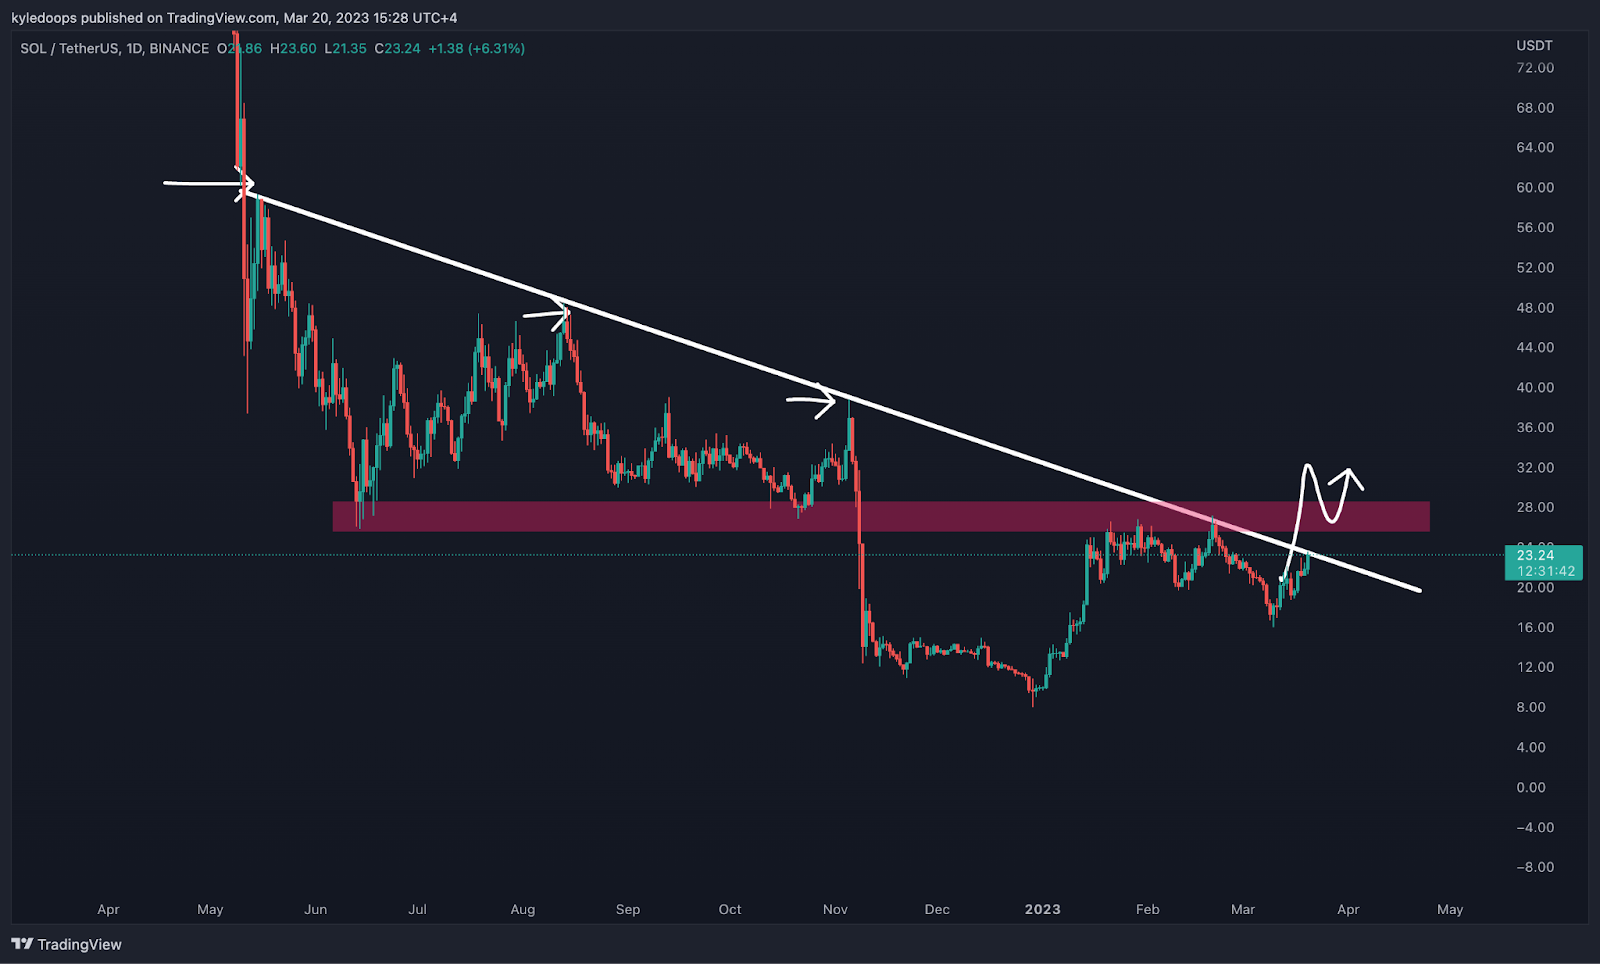
Chart #3 - Solana (SOLUSDT) 1-Day Chart
Chartist: Kyle
(For the chart screenshot, click here.)
Despite SOL outperforming most of the market today, taking out a long trade on it is highly risky.
SOL is at a very key level and currently pressing up against strong resistance. The resistance is formed not only of a diagonal resistance trend line but also of horizontal underside resistance.
So, I'll wait for it to break through all of that resistance, and then I'll start looking at getting into a long trade once it flips the resistance into support.
Claim your Bitget sign-up bonuses here (details below).
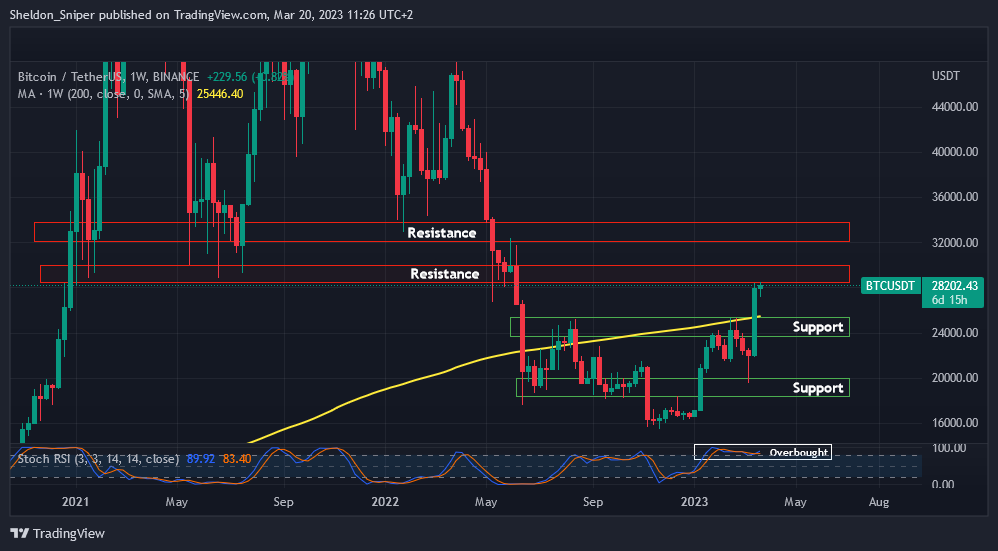
Chart #4 - Bitcoin (BTCUSDT) 1-Week Chart
Chartist: Sheldon
(For the chart screenshot, click here.)
The past week has been massive for bitcoin, with the price going from $22,000 up to $28,360, after having ended last week above the 200 weekly moving average at $25,340 - creating a weekly bullish engulfing candle in the process.
It now finds itself at a major level of resistance which held as support multiple times in 2021 and May last year. The problem is many people bought at that level so may be looking to offload once bitcoin reaches it again, creating a massive sell-wall.
If the price manages to break through the current resistance and head up to $30,000, the next resistance zone is at $32,000 - $34,000. But the indicators are overbought on higher time frames, so if bitcoin gets rejected here, it could head down to its 200 weekly moving average ($25,340 - $23,900), or even reach the $18,800 - $20,000 area.
Claim your Bitget sign-up bonuses here (details below).
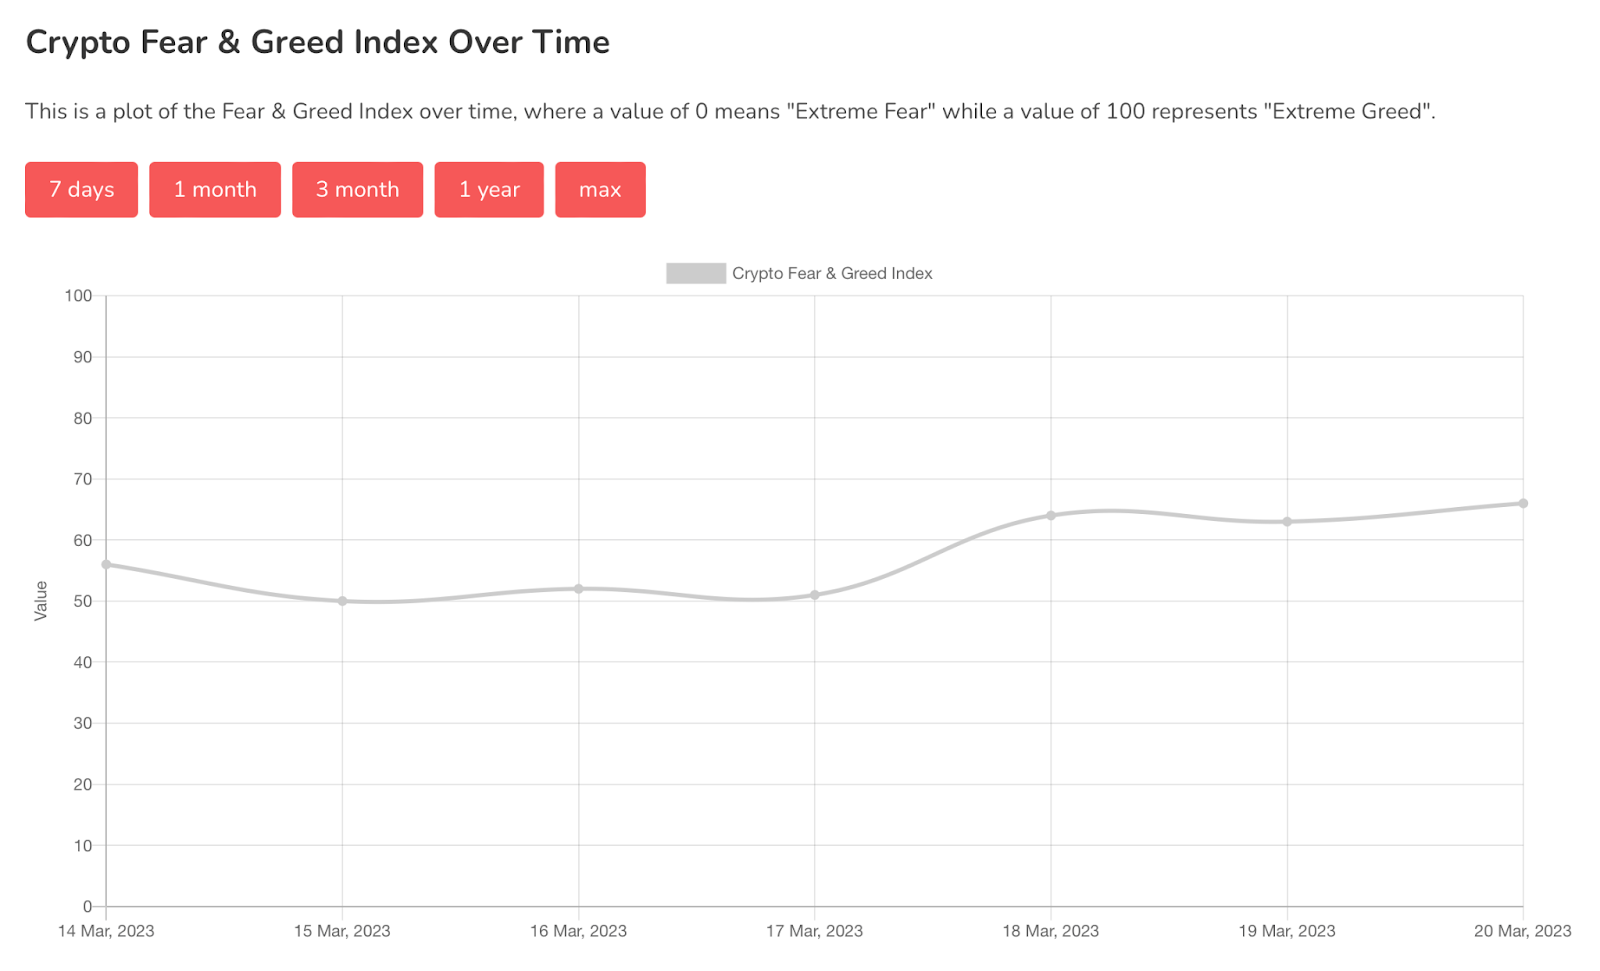
Chart #5 - Bitcoin Fear and Greed Index
The Bitcoin Fear and Greed Index is sitting at 66 today, indicating Greed.
The highest the index has been over the past seven days is 66, and the lowest is 50.
Overall Market Sentiment (Banter’s Take)
Market participants are highly excited over the recent price action, and rightfully so. But now is not the time to FOMO into the market. We got the move from the lows, and now bitcoin is approaching resistance. Therefore market participants will be looking for price levels to take profits at.
Aggressive traders may even be looking for short opportunities.
Stay safe my friends!
Go to our Crypto Banter Discord here where Sheldon and Kyle give updates on the charts and trades from The Daily Candle newsletter!
Bybit winner - 28640999