

📈📉 Bitcoin higher low could lead to 171% increase! S&P 500 looking bullish!
📈📉 Bitcoin higher low could lead to 171% increase! S&P 500 looking bullish!

Bitget winner - 2895669097
First things first!
Sniper School kicks off a new cohort next week!
What is Sniper School? A free 3-week trading course with Sheldon. You will learn how to trade like a pro in 3 short weeks and capitalize on the change in the markets.
There are only 3k seats and the waitlist is filling up fast! We still have some spots left for those that complete the entrance requirements of signing up for a fee exchange account and funding it. You’ll use it to trade live during the course.
The course includes weekly live workshops hosted by Sheldon, Mama Sniper, and special guests, plus daily live trading and market analysis sessions with our team of Sniper Mentors!
It’s not just a school. It really is the start of an incredible journey with our family of degens! Reserve your spot now by clicking here.
Chart #1 - Solana (SOLUSDT) 12-Hour Chart
Chartist: Sheldon
(For the chart screenshot, click here.)
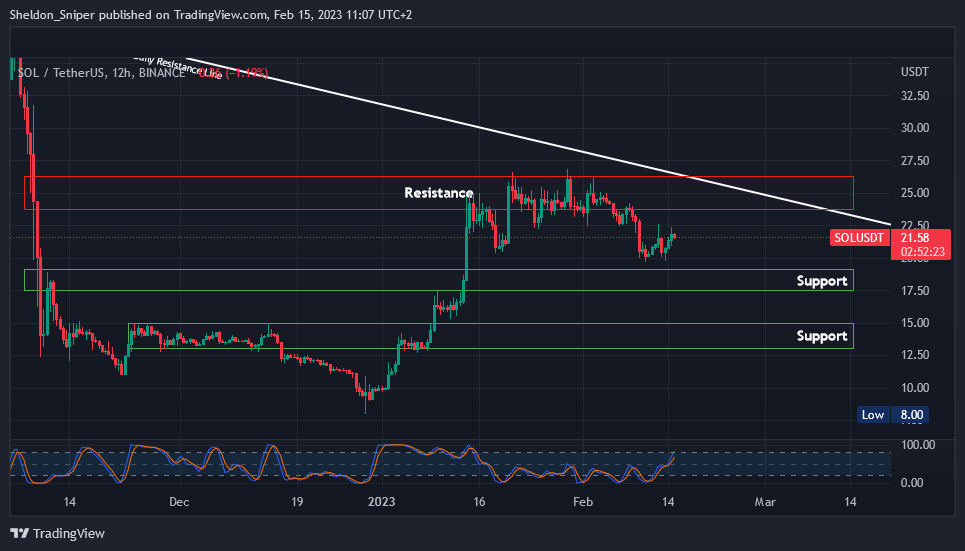
Over the last two weeks, SOL has retraced from a local high of just over $26, down to around $19.50, where it found support, before bouncing up to where it is currently trading, at $21.60.
There is a minor level of resistance, around $22.50, that SOL has tested twice this past week. If it can break through, it may head up to the major resistance area between $23 - $26.
If SOL drops from here, the next levels of support are between $17.50 - $19.00 and below that between $13.00 - $15.00.
SOL performed nicely in the last cycle, and I think it could possibly test higher levels in the next couple of weeks.
Check our Crypto Banter Discord here for updates!
Follow me on Twitter for urgent updates on my trading progress!
Claim your Bitget sign-up bonuses here (details below).
Chart #2 - S&P 500 1-Month Chart
Chartist: Kyle
(For the chart screenshot, click here.)
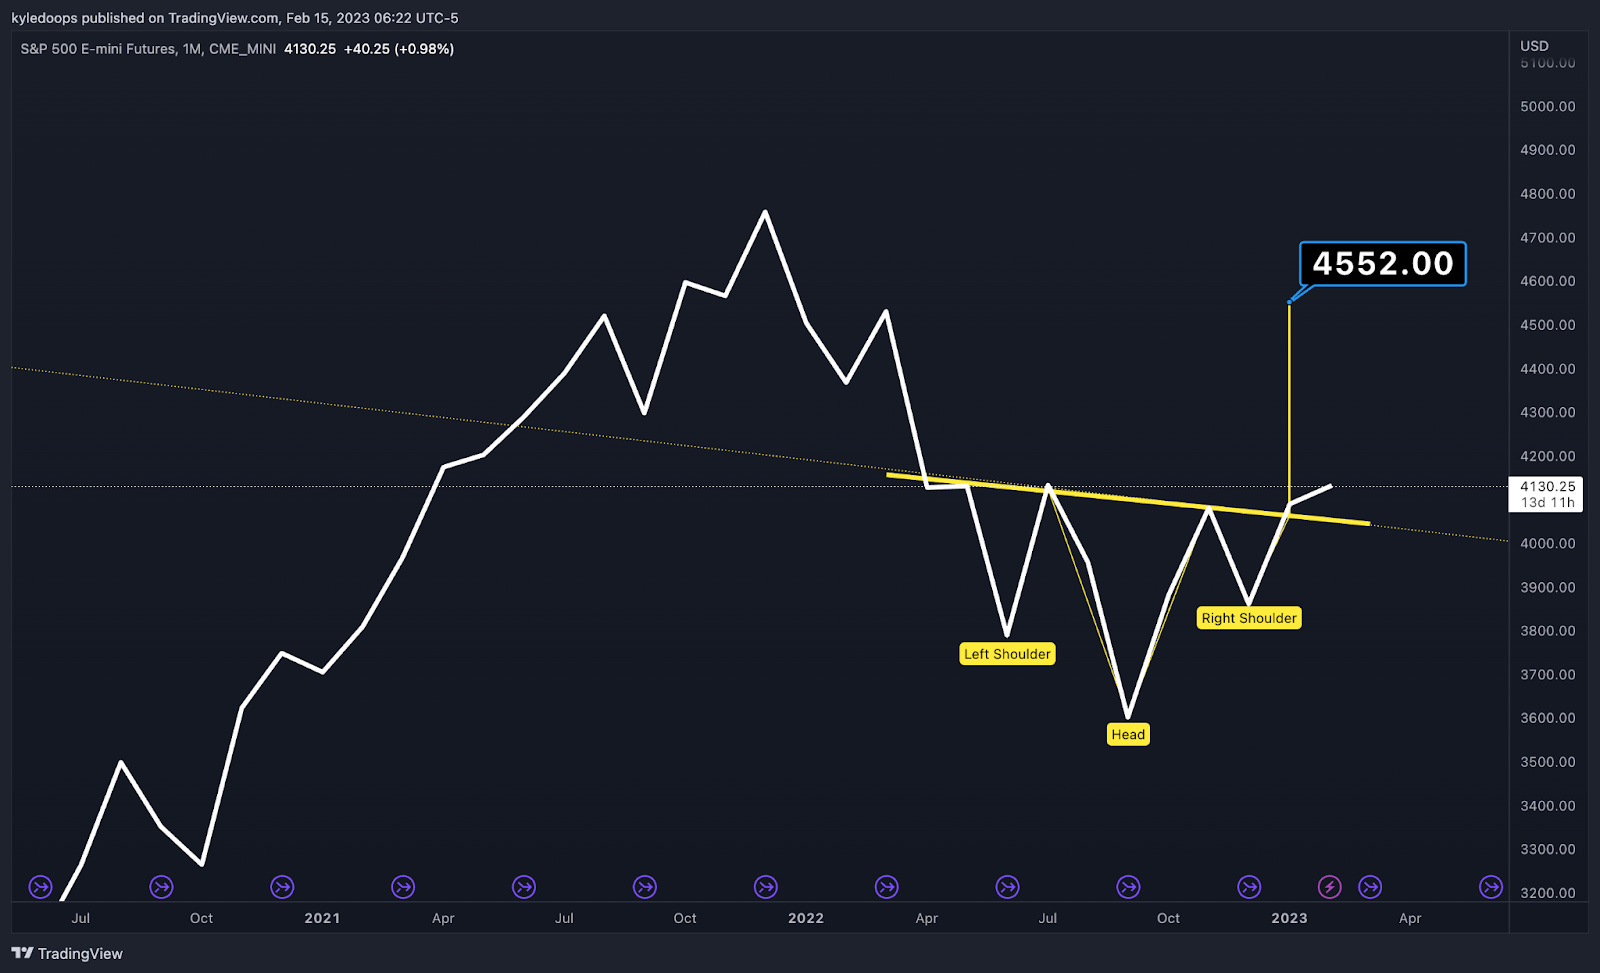
This is not a call as it's on a very high timeframe, but it is noteworthy to mention.
Many are caught in a very biased thought process, and just considering the bullish case can assist with helping us be more neutral and grounded. The stock market is currently making a picture-perfect inverse head and shoulders pattern, which, if confirmed, would have an enormous breakout target of 4,552.
Check our Crypto Banter Discord here for updates!
Make sure to follow me on Twitter, where I will post updates on my trades as they unfold!
Claim your Bitget sign-up bonuses here (details below).
Chart #3 - Bitcoin (BTCUSD) 1-Day Chart
Chartist: Kyle
(For the chart screenshot, click here.)
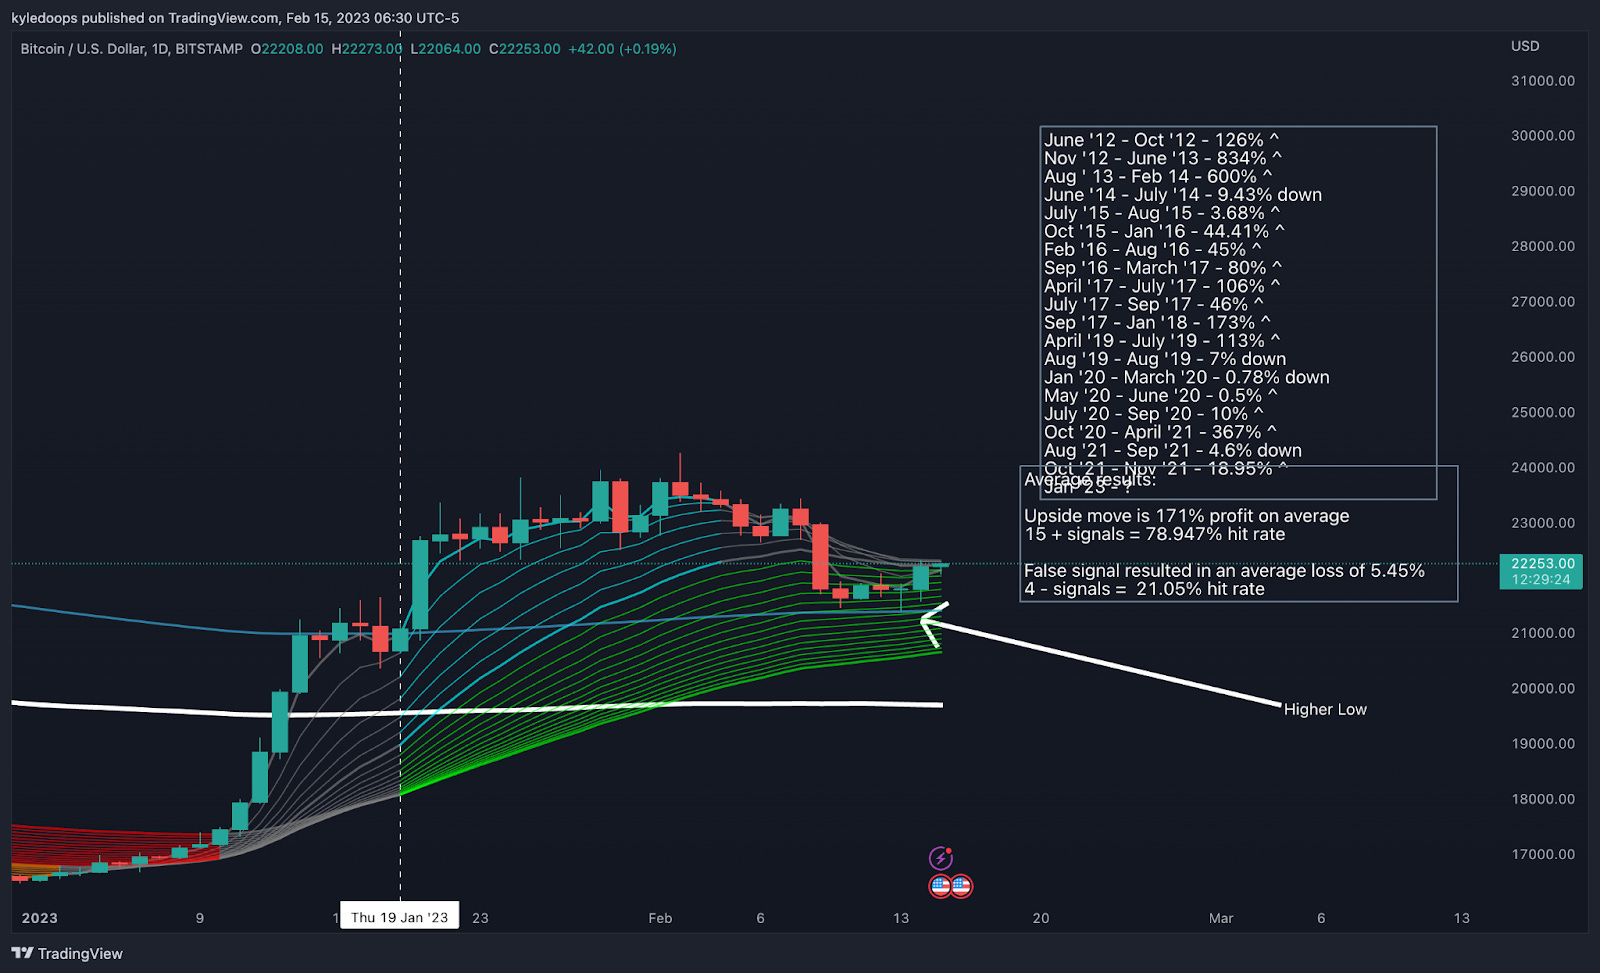
Bitcoin may have just set in its higher low on the daily chart.
Confirmation of this would be a close above $23,350. If that happens, I will consider $25,500 as the next target. If it all plays out according to historical data, bitcoin could move up as high as 171%. That seems like a bold statement, but the statement is based on historical statistics. I would be looking at it as level-to-level plays with $25,500 first and then $28,000. Then we take it from there.
A loss of $21,300 would invalidate everything and be incredibly bearish.
Check our Crypto Banter Discord here for updates!
Make sure to follow me on Twitter, where I will post updates on my trades as they unfold!
Claim your Bitget sign-up bonuses here (details below).
Chart #4 - TOTAL 6-Hour Chart
Chartist: Sheldon
(For the chart screenshot, click here.)
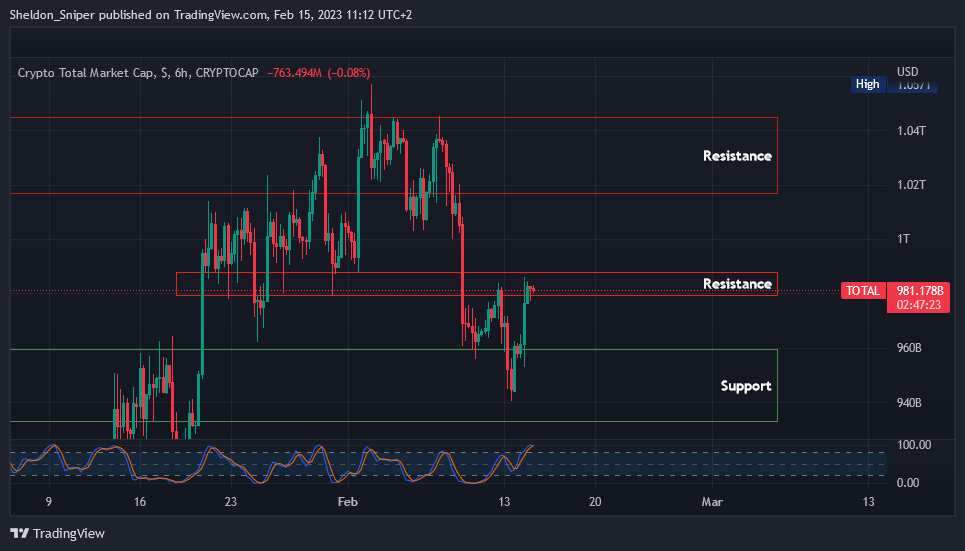
At the beginning of February, the TOTAL dropped from $1.05T down to $940B (support), but over the last few days, it has moved from there to where it is currently trading, at just over $980B (resistance).
Revisiting $980B could be seen as a retest of that level, with further continuation to the downside to follow. But if the TOTAL can break through, the next resistance is roughly between $1T - $1.04 T.
A rejection and drop lower from the $980B level will take the TOTAL down to its next support between $930B - $960B.
Check our Crypto Banter Discord here for updates!
Follow me on Twitter to get all the updates on my personal trading progress!
Claim your Bitget sign-up bonuses here (details below).
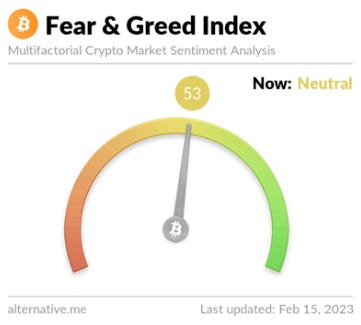
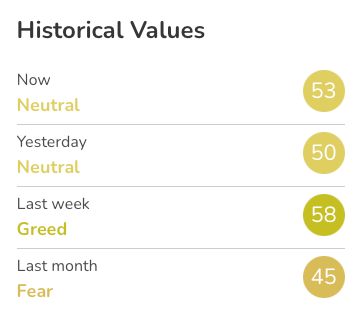
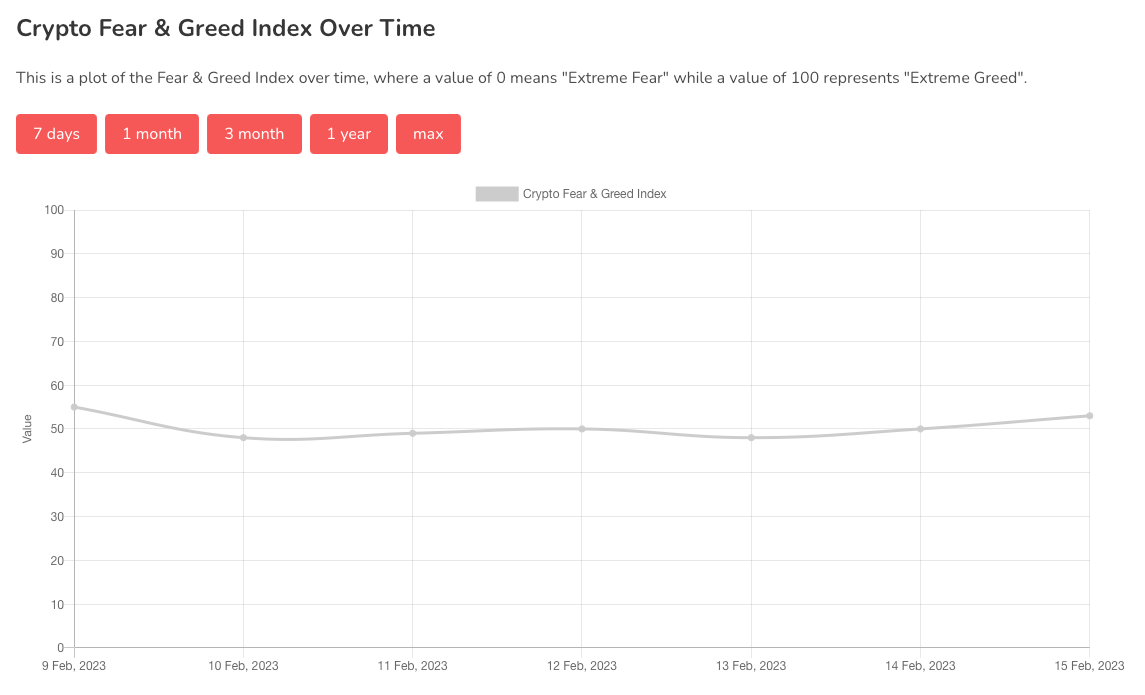
Chart #5 - Bitcoin Fear and Greed Index
The Bitcoin Fear and Greed Index is sitting at 53 today, Neutral.
The highest the index has been over the past seven days is 55, and the lowest is 48.
Overall Market Sentiment (Banter’s Take)
The tides appear to be turning within the markets, and as long as bitcoin can prove it's created a higher low here, the momentum will continue to build.
There are no major economic events that will interfere with speculators driving prices until 22 Feb - the FOMC minutes.
Stay safe my friends!
Bybit winner - 53513482