

📈📉Bitcoin is Losing THIS Key Level!
📈📉Bitcoin is Losing THIS Key Level!
Game Over? Or Time to BUY the DIP?
Overview
Chart #1 - Solana (SOLUSDT) 3-Day
Chart #2 - Bitcoin (BTCUSD) Hourly
Chart #3 - Solana (SOLUSDT) Daily
Chart #4 - S&P 500 (SPX) Daily
Chart #5 - Fear and Greed Index

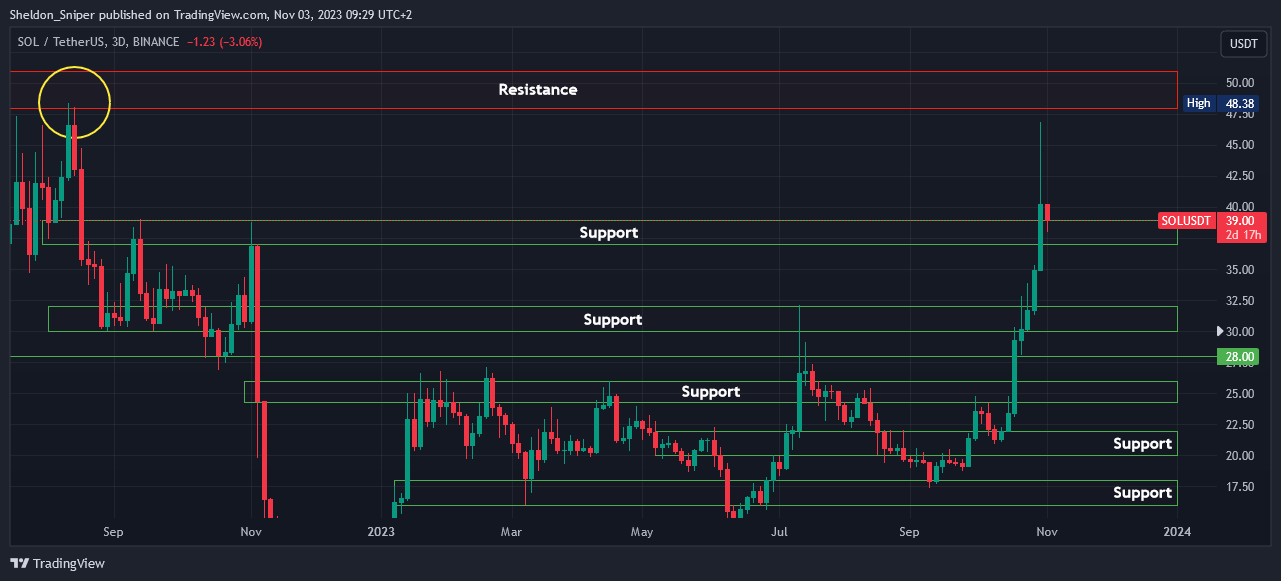
Chart #1 - Solana (SOLUSDT) 3-Day
Chartist: Sheldon
(For the chart screenshot, click here.)
SOL made a massive move in October, so there is a possibility of a retrace now.
If this area of support doesn’t hold, the next one is at $30.00 - $32.50.
That being said, if crypto continues its momentum to the upside over the next couple of weeks, I expect SOL to continue its bullish momentum to the upside and test $48.00 - $51.00.
Sign-up and trade on Bybit today.
Exclusive $30,000 deposit rewards and bonuses up for grabs!
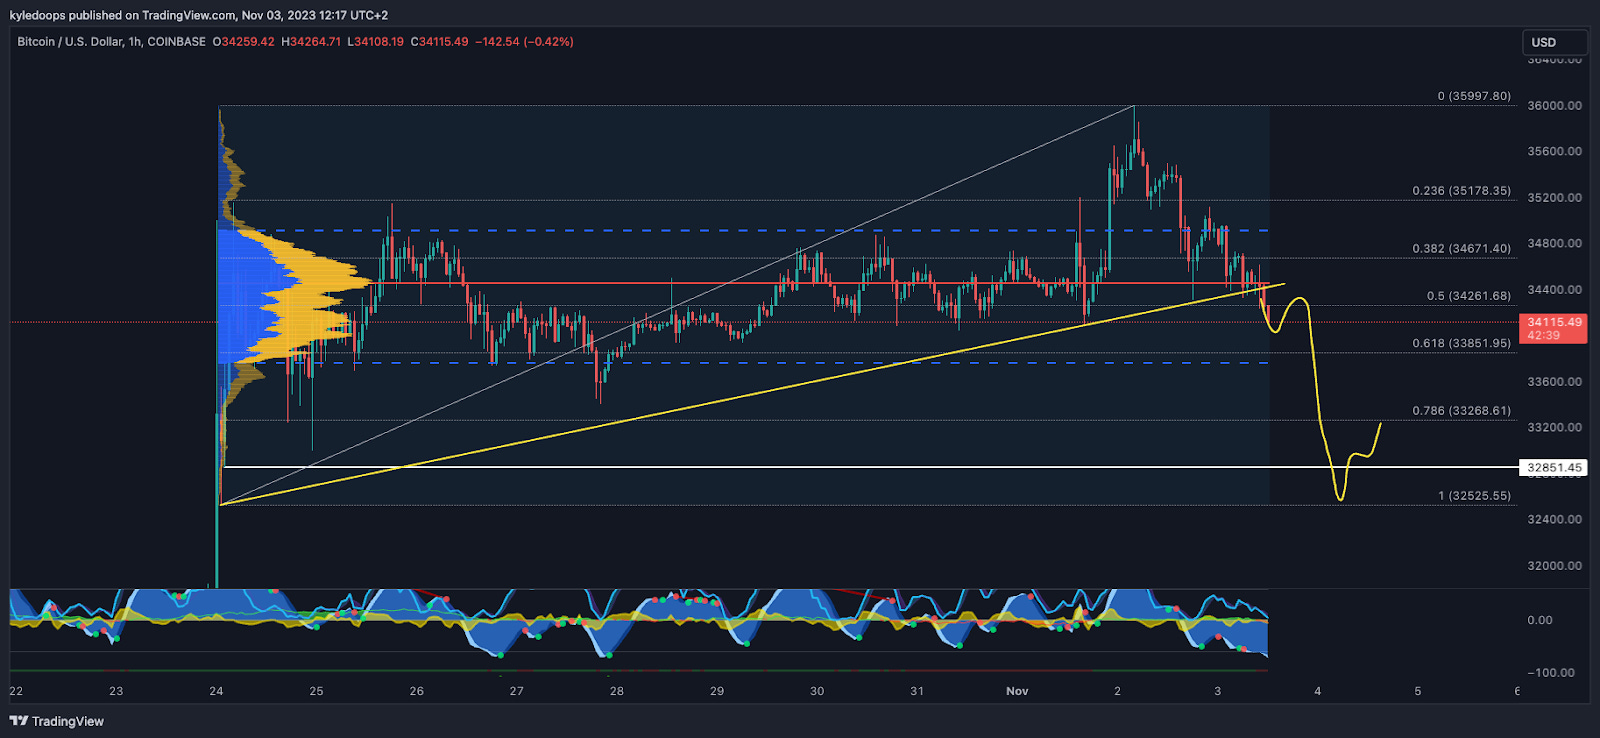
Chart #2 - Bitcoin (BTCUSD) Hourly
Chartist: Kyle
(For the chart screenshot, click here.)
Bitcoin is losing a key level: the point of control at $34,447.
There is a good chance that it will sweep the low at $32,525.
If the price reclaims the point of control, then it could be a bear trap with a false breakdown. Either way, Bitcoin is still in a larger bull flag, so the range should continue to hold.
Claim your Bitget sign-up bonuses here (details below).

For more premium content like this, be sure to take advantage of our limited offer to the Whale Room Discord at 25% off for the first 3-months.
Apply the promo code “DOOPS”.
Limited to the first 50 people!
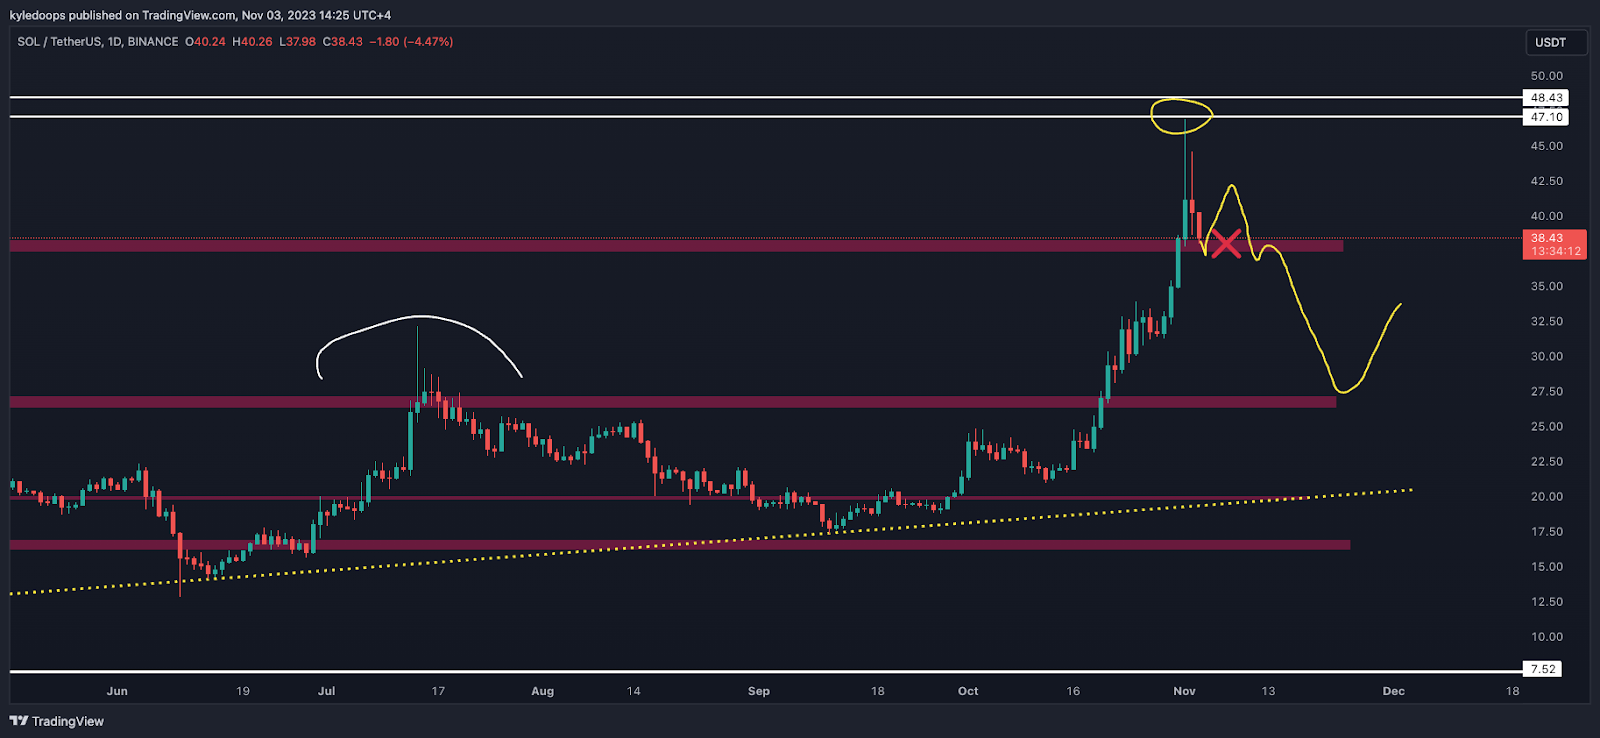
Chart #3 - Solana (SOLUSDT) Daily
Chartist: Kyle
(For the chart screenshot, click here.)
SOL could be putting in a major top, especially coming into the end of the Solana Breakpoint conference in Amsterdam.
Watch for a bounce into the mid-range at $42.50, and then losing the $38 level will confirm that the breakdown is happening.
If that happens, then the price will likely head down to $26; that would be a good opportunity to catch a bounce.
Claim your Bitget sign-up bonuses here (details below).
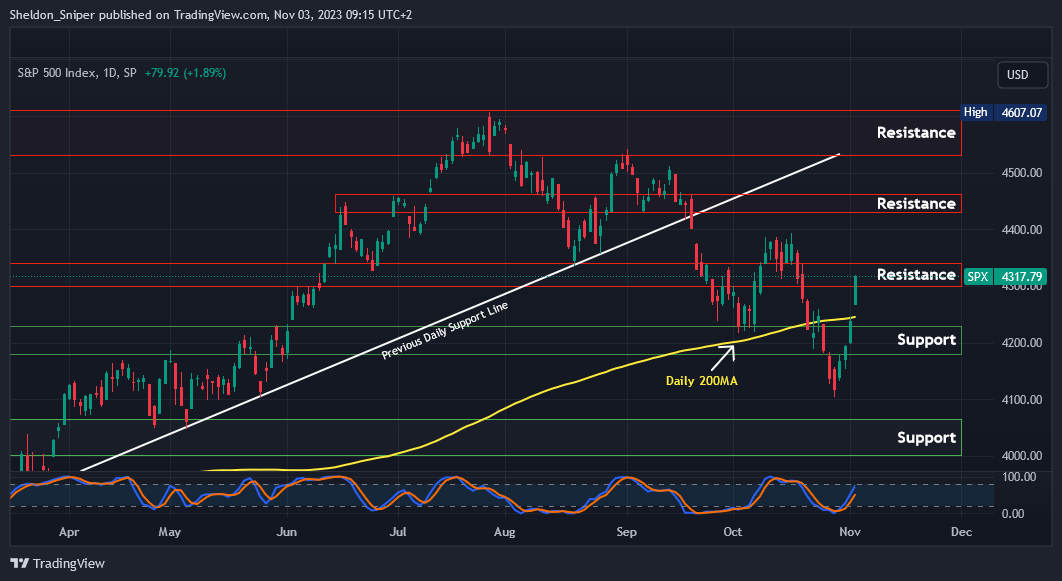
Chart #4 - S&P 500 (SPX) Daily
Chartist: Sheldon
(For the chart screenshot, click here.)
The SPX has now reached the 4,300 - 4,325 area of resistance.
Meanwhile, the US 10 Year Yield and the DXY have started to retrace, so I think the SPX has upside potential, where it could test 4,430 - 4,450.
But, if it does, I believe it will once again find it very difficult to break through.
Claim your Bitget sign-up bonuses here (details below).

🚀 Sniper School's New Cohort Begins November 7th!
Sniper School is a free 3-week trading course led by Sheldon. Dive deep into his strategies and insights to master the art of trading. Equip yourself with the skills to capitalize on market shifts and maximize your gains.
Limited Seats! With only 3,000 seats available, our waitlist fills up rapidly! Secure Your Seat Today!
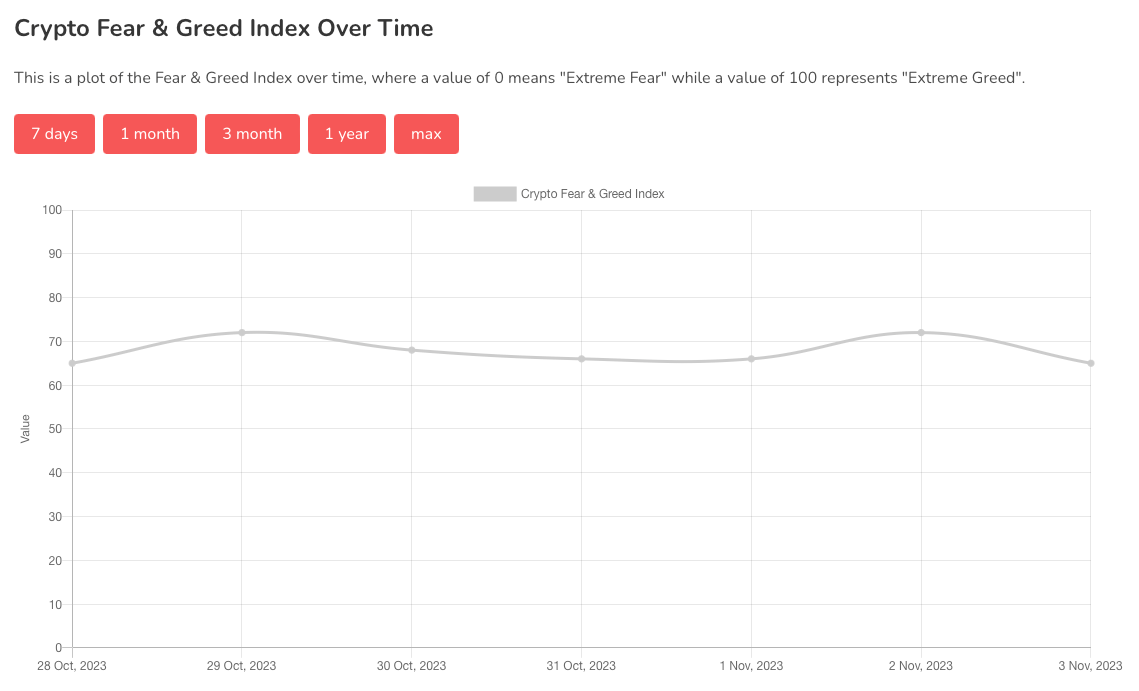
Chart #5 - Fear and Greed Index
The Fear and Greed Index is sitting at 65 today, indicating Greed.
The highest the index has been over the past seven days is 72, and the lowest is 65.
Banter’s Take
The pullback continues, but there is strong support below. If the market is truly bullish, then all pullbacks should be eaten up quickly.
Stay safe my friends!
Go to our Crypto Banter Discord here where Sheldon and Kyle give updates on the charts and trades from The Daily Candle newsletter!