

📈📉 Bitcoin Must Hold This Level! Kava is Bullish and Heading to…
📈📉 Bitcoin Must Hold This Level! Kava is Bullish and Heading to…

Chart #1 - Kava (KAVAUSDT) 1-Day Chart
Chartist: Sheldon

(For the chart screenshot, click here.)
Over the past five months, Kava has been trading within a range of $0.70 to $1.20. Currently, the price is once again testing the range's upper resistance around $1.20.
Kava has exhibited extreme bullishness over the past couple of weeks. If the price finds support around $1.15, there's a possibility that it could break the range's upper resistance of $1.20 and head to test the next major resistance at $1.40 - $1.45.
If the price gets rejected at $1.15, then the next level of support lies at $1.00. The daily support line would provide additional support in this area.
𝗣𝗿𝗶𝗺𝗲 𝗫𝗕𝗧
Sign up for a new Trading Account on Prime XBT!
Receive a deposit bonus of up to $7,000 with promo code: SheldonSniper
Chart #2 - Bitcoin (BTCUSD) 4-Hour Chart
Chartist: Kyle

(For the chart screenshot, click here.)
Following yesterday's nice pump in price, BTC approached the 200 EMA and began to reject.
Bulls will be aiming to step in and defend the $26,500 level. A failure to maintain above that level could mean a trap is underway. If that happens, the entire previous pump might be at risk of retracement.
𝗣𝗿𝗶𝗺𝗲 𝗫𝗕𝗧
Sign up for a new Trading Account on Prime XBT!
Receive a deposit bonus of up to $7,000 with promo code: KyleDoops
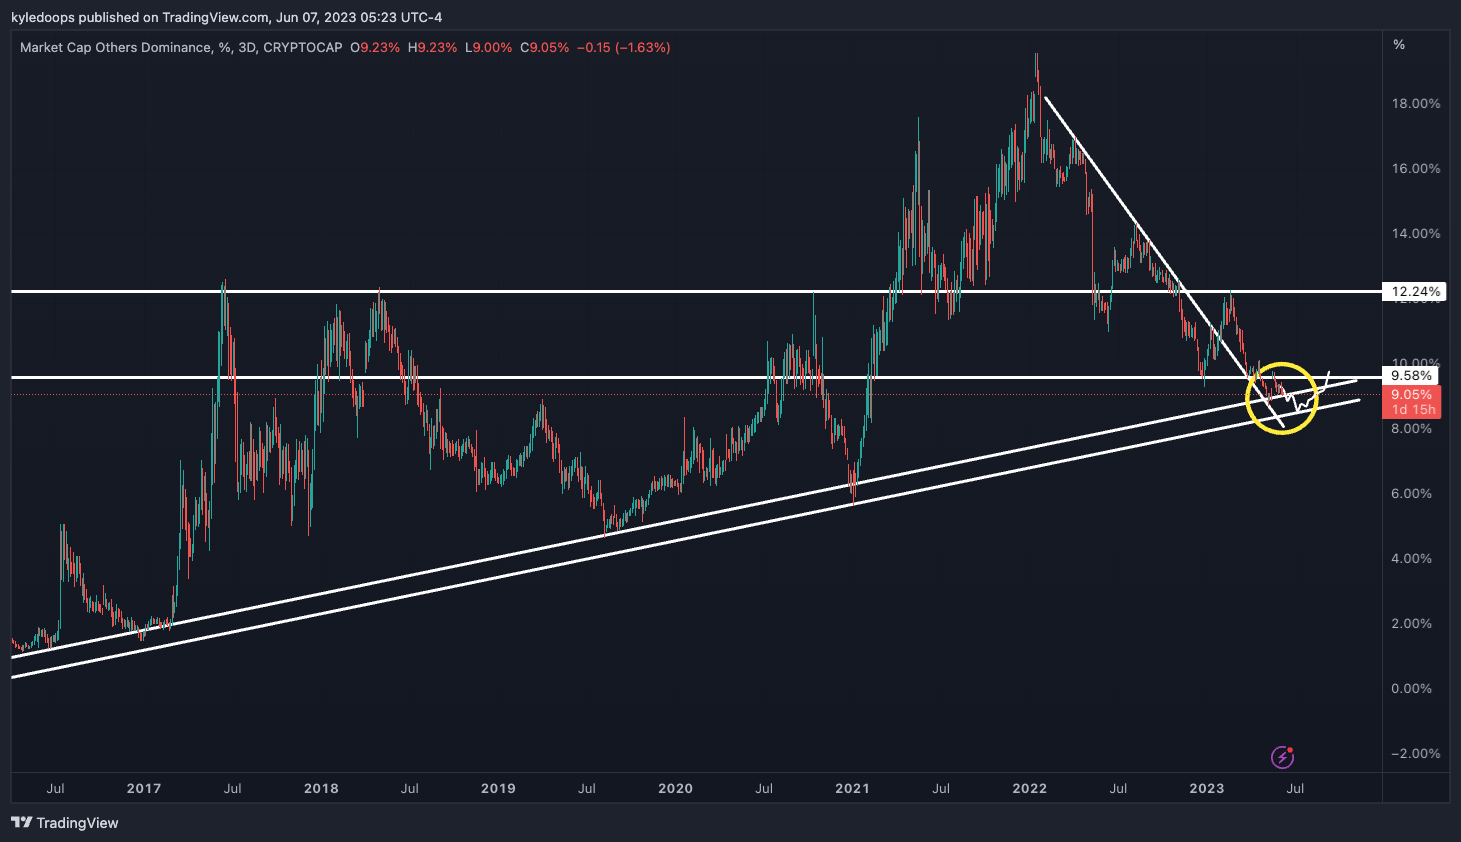
Chart #3 - Others Dominance 3-Day Chart
Chartist: Kyle
(For the chart screenshot, click here.)
This refers to all altcoins ranked beyond the top 10 on CoinMarketCap, starting from position 11 onwards.
Others Dominance is currently nearing a very crucial support level. If it begins to rebound from here, it could potentially trigger a rally in altcoins. A reclaim of 9.58% would serve as a trigger for a safer entry point into altcoins.
Claim your Bitget sign-up bonuses here (details below).
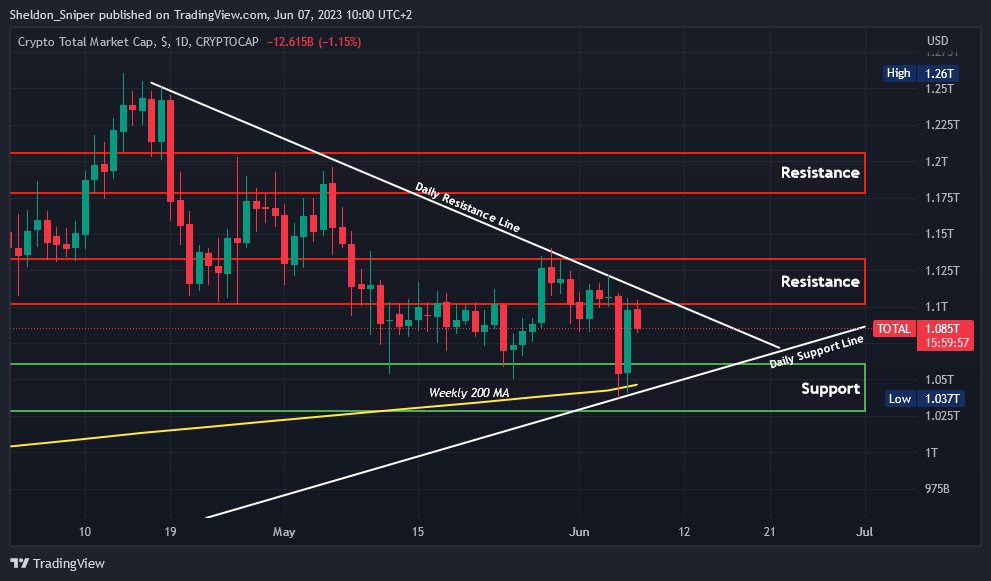
Chart #4 - TOTAL 1-Day Chart
Chartist: Sheldon
(For the chart screenshot, click here.)
Yesterday, the TOTAL rallied from approximately $1.037T to over $1.1T. This surge happened after the range of $1.02T - $1.06T held as support alongside the weekly 200 Moving Average and the daily ascending support line.
A triple whammy!
This morning, however, the Total got rejected at the $1.1T resistance level. Now, there's a possibility of a retest down to around $1.08T. If that level can hold as support, then the market should rise and retest the $1.1T - $1.3T resistance area, as well as the daily descending resistance line originating from mid-April.
Claim your Bitget sign-up bonuses here (details below).
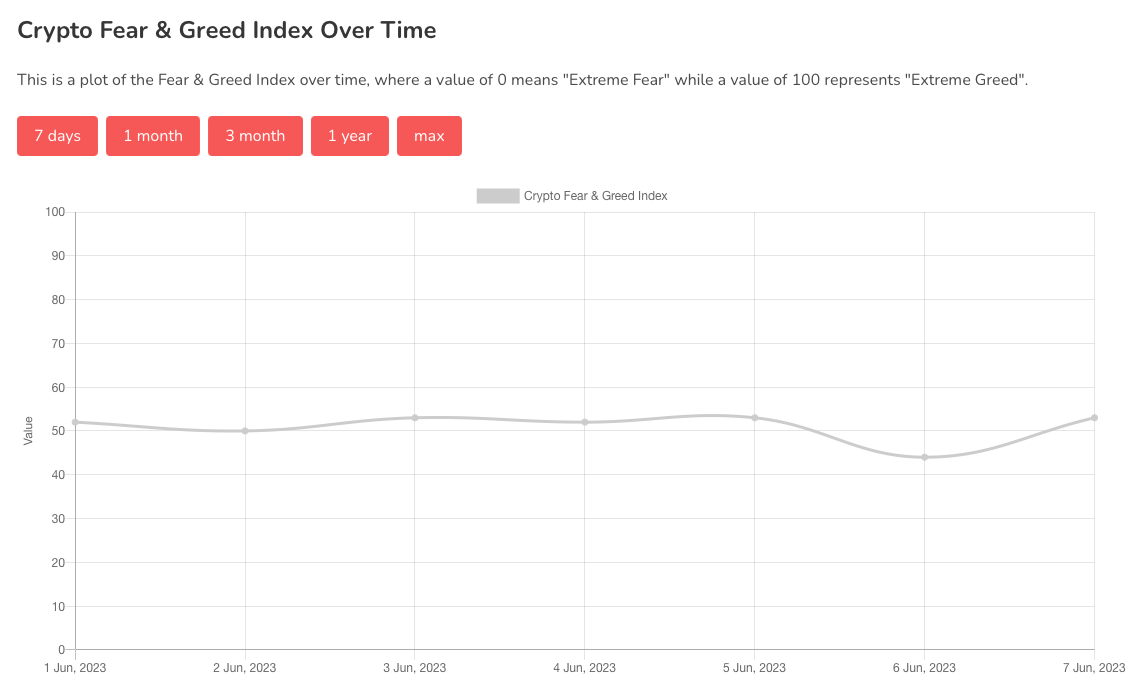
Chart #5 - Bitcoin Fear and Greed Index
The Bitcoin Fear and Greed Index is sitting at 53 today, Neutral.
The highest the index has been over the past seven days is 53, and the lowest is 44.
Banter’s Take
The ball is in the bulls court right now!
If they want to defeat the bears, bulls need to defend $26,500 and run the price past that level. Once above $27,000 bulls can start to target $28,200 as the next upside resistance.
Stay safe my friends!
Go to our Crypto Banter Discord here where Sheldon and Kyle give updates on the charts and trades from The Daily Candle newsletter!