

📈📉 Bitcoin On the Brink: Will it Bounce Back?
📈📉 Bitcoin On the Brink: Will it Bounce Back?

Overview:
Chart #1 - Near
Chart #2 - Bitcoin
Chart #3 - Bitcoin Dominance
Chart #4 - U.S. Dollar
Chart #5 - Bitcoin Fear and Greed Index

Real Vision membership packages help you understand the complex world of crypto and macro, with real in-depth analysis!
Get your membership package 👉 here, and benefit from SPECIAL Crypto Banter discounted prices!
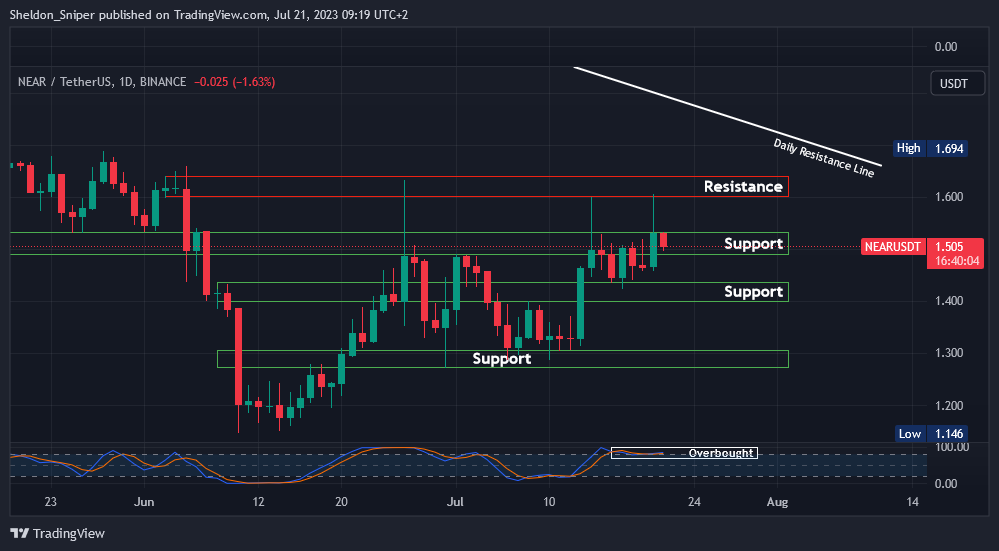
Chart #1 - Near (NEARUSDT) 1-Day Chart
Chartist: Sheldon
(For the chart screenshot, click here.)
Over the past week, NEAR has rallied by almost 25%, moving from around $1.30 up to $1.60, where the price was rejected. NEAR is currently trading at $1.50, also within the $1.50 - $1.55 area of support.
With the price being overbought on higher time frames, I expect NEAR to either consolidate in this support area or potentially drop down to the next area of support at $1.40 - $1.45.
This could set the stage for the price to move higher and test the $1.60 - $1.65 area, or even the daily descending resistance line that originates from November, located at around $1.70.
Sign-up and trade on Bybit today.
Exclusive $30,000 deposit rewards and bonuses up for grabs!
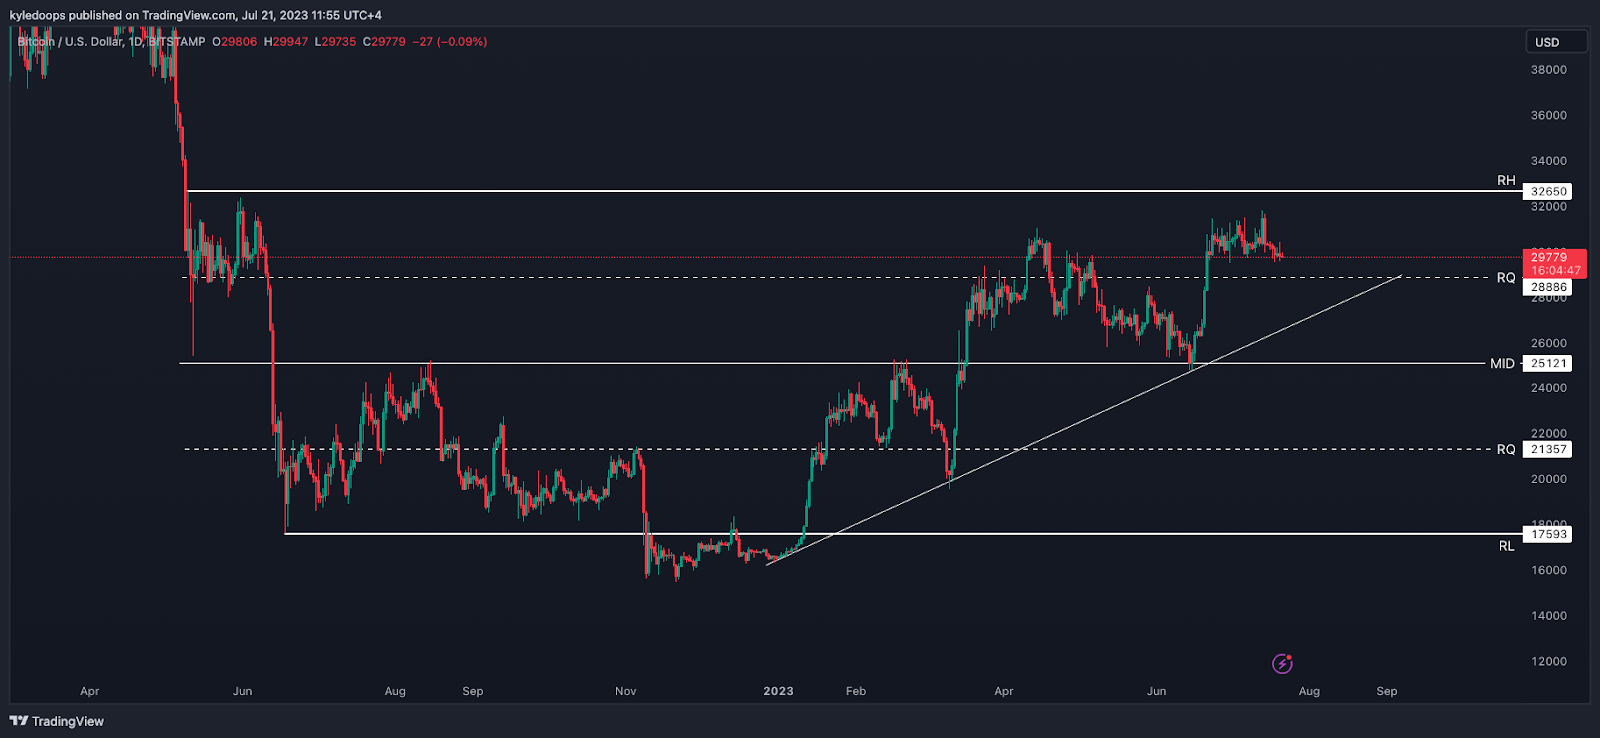
Chart #2 - Bitcoin (BTCUSD) 1-Day Chart
Chartist: Kyle
(For the chart screenshot, click here.)
BTC is still caught within a broader range.
Should it drop further down, it is likely to find support at the quarterly range level of $28,965.
I'd anticipate a sweep of that level, followed by a direct push back up to clear the range high at $32,650.
𝗣𝗿𝗶𝗺𝗲 𝗫𝗕𝗧
Sign up for a new Trading Account on Prime XBT!
Receive a deposit bonus of up to $7,000 with promo code: KyleDoops

Sign up for a new Trading Account on Prime XBT!
Receive a deposit bonus of up to $7,000 with promo code: SheldonSniper
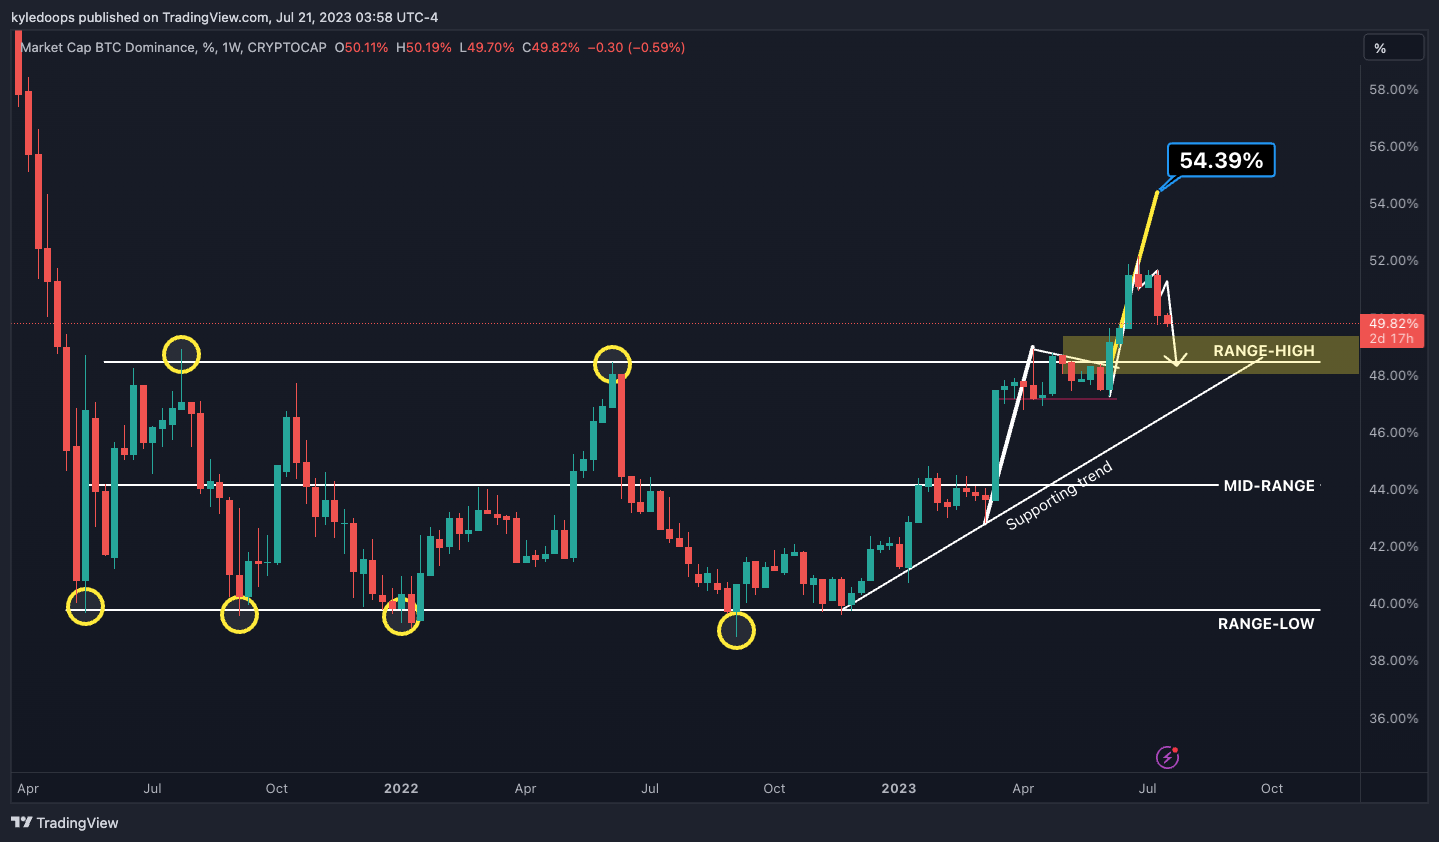
Chart #3 - Bitcoin Dominance (BTC.D) 1-Week Chart
Chartist: Kyle
(For the chart screenshot, click here.)
BTC dominance is receding back towards the breakout level at 48.41%.
This was the breakout level from the bull flag, which had a measured move up to 54.39%. Although that pattern appears to have failed at this point, it's not over until Bitcoin dominance breaks back down into the range.
This means it needs to lose the 48.41% level.
Claim your Bitget sign-up bonuses here (details below).
Chart #4 - U.S. Dollar (DXY) 3-Day Chart
Chartist: Sheldon

(For the chart screenshot, click here.)
Last week, the DXY broke through the major range low support of 101.80.
The recent weakness in the US Dollar has resulted in a rally in the stock market and, to a degree, in the crypto market. The question now is whether the Dollar can continue weakening.
After finding support around 99.50, the DXY has gone up to retest the previous range low of 101.80. If there is a rejection in this area, then there is a possibility of the Dollar weakening further, potentially testing the next area of support at 99.50 - 100.
Claim your Bitget sign-up bonuses here (details below).
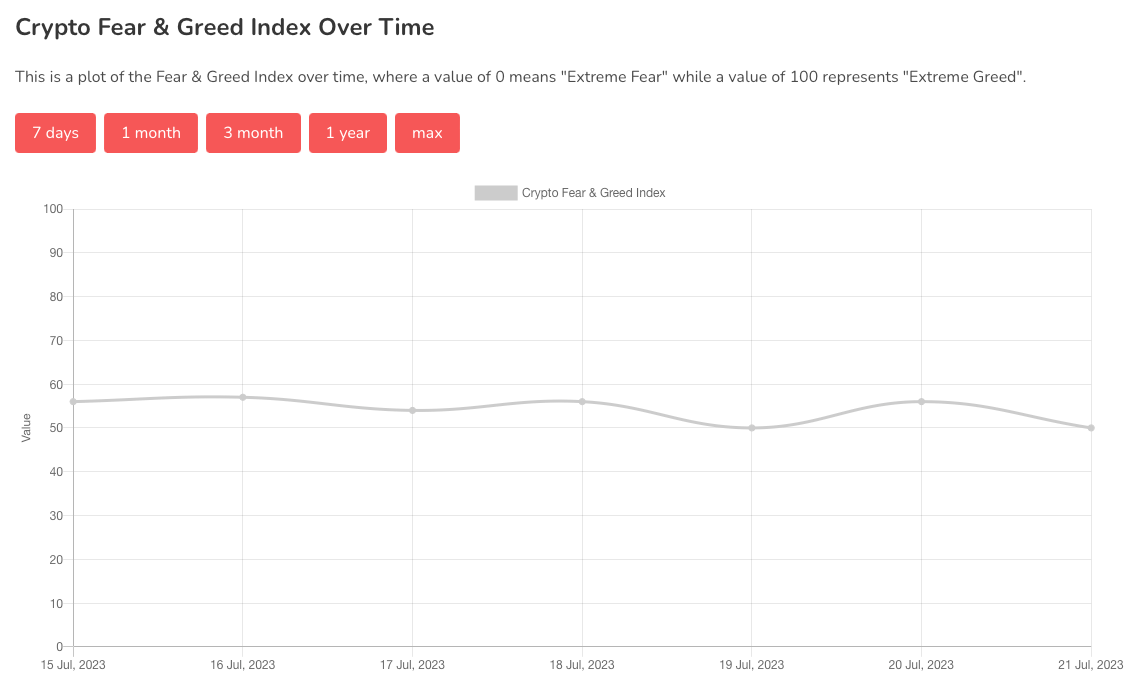
Chart #5 - Bitcoin Fear and Greed Index
The Bitcoin Fear and Greed Index is sitting at 50 today, Neutral.
The highest the index has been over the past seven days is 57, and the lowest is 50.
Banter’s Take
The market is getting spooked by the announcement that the US government is selling Bitcoin again.
It's likely that this Bitcoin will get absorbed and prices will continue to rise. Higher highs and higher lows on the larger time frame persist.
Stay safe my friends!
Go to our Crypto Banter Discord here where Sheldon and Kyle give updates on the charts and trades from The Daily Candle newsletter!