

📈📉 Bitcoin pattern indicates trend reversal! DXY bouncing?
📈📉 Bitcoin pattern indicates trend reversal! DXY bouncing?

Bitget winner - 3611948468
Chart #1 - Ethereum (ETHUSDT) 12-Hour Chart
Chartist: Sheldon

(For the chart screenshot, click here.)
With its indicators overbought on the 4HR, 8HR, and 12HR charts, it looks like ETH is coming down to retest support at $1,800 - $1,850.
A retest of that support could result in buyers entering the market and pushing ETH up past $1,950 - $2,000, a resistance zone that it failed to cross yesterday.
𝗣𝗿𝗶𝗺𝗲 𝗫𝗕𝗧
Sign up for a new Trading Account on Prime XBT!
Receive a deposit bonus of up to $7,000 with promo code: SheldonSniper
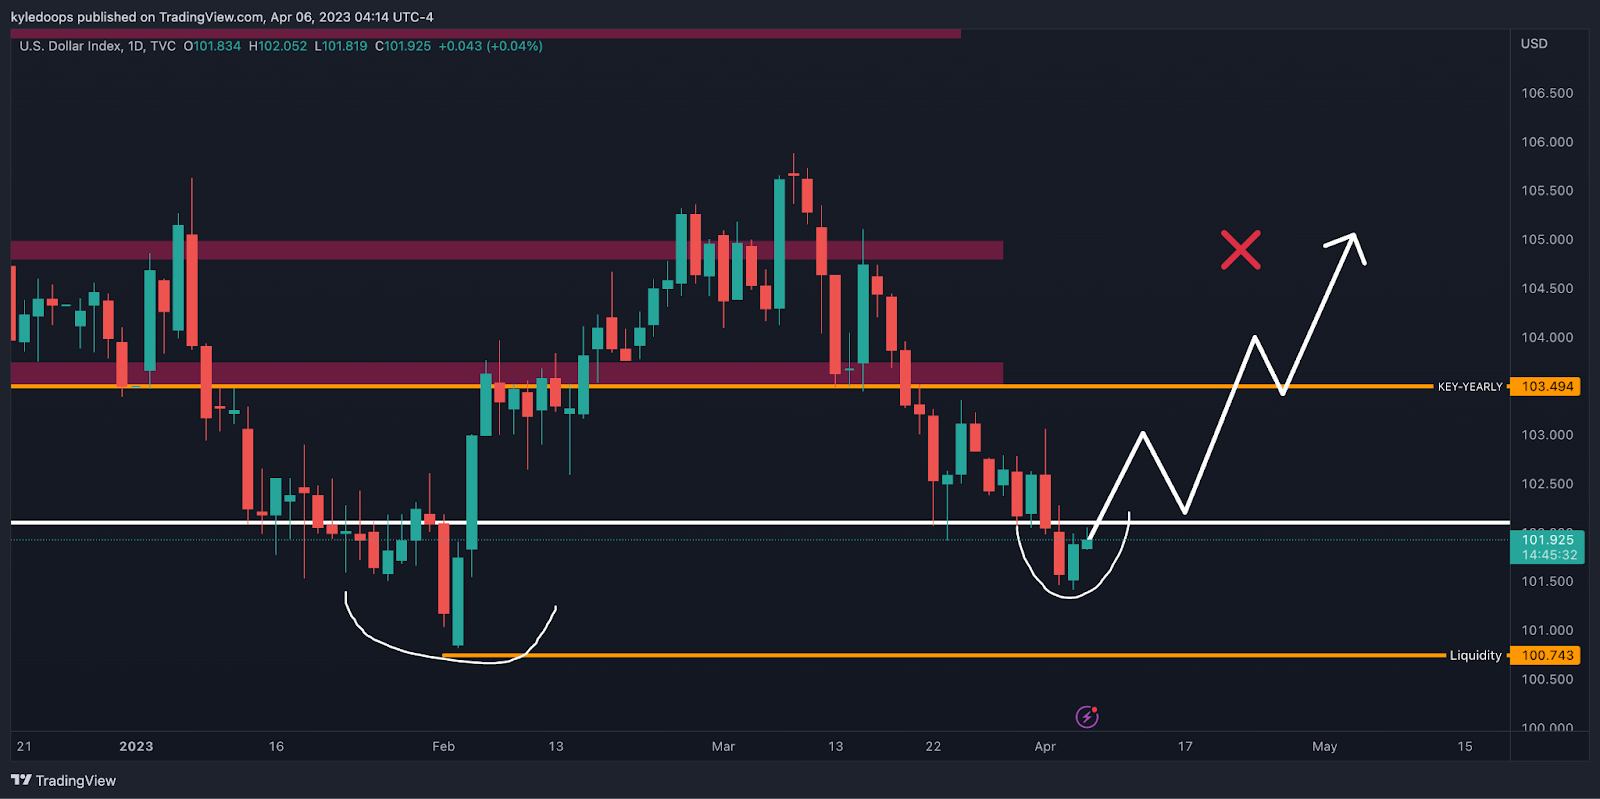
Chart #2 - DXY 1-Day Chart
Chartist: Kyle
(For the chart screenshot, click here.)
The DXY may have set its higher low, as it's coming off of a key level of support.
It's worth watching how this plays out since a proper bounce in the dollar will likely lead to downside pressure for risk-on assets, like crypto and stocks.
If, however, the dollar starts to lose the 100 level to the downside, then bitcoin will likely push through its current resistance and into the $32,000 region.
𝗣𝗿𝗶𝗺𝗲 𝗫𝗕𝗧
Sign up for a new Trading Account on Prime XBT!
Receive a deposit bonus of up to $7,000 with promo code: KyleDoops

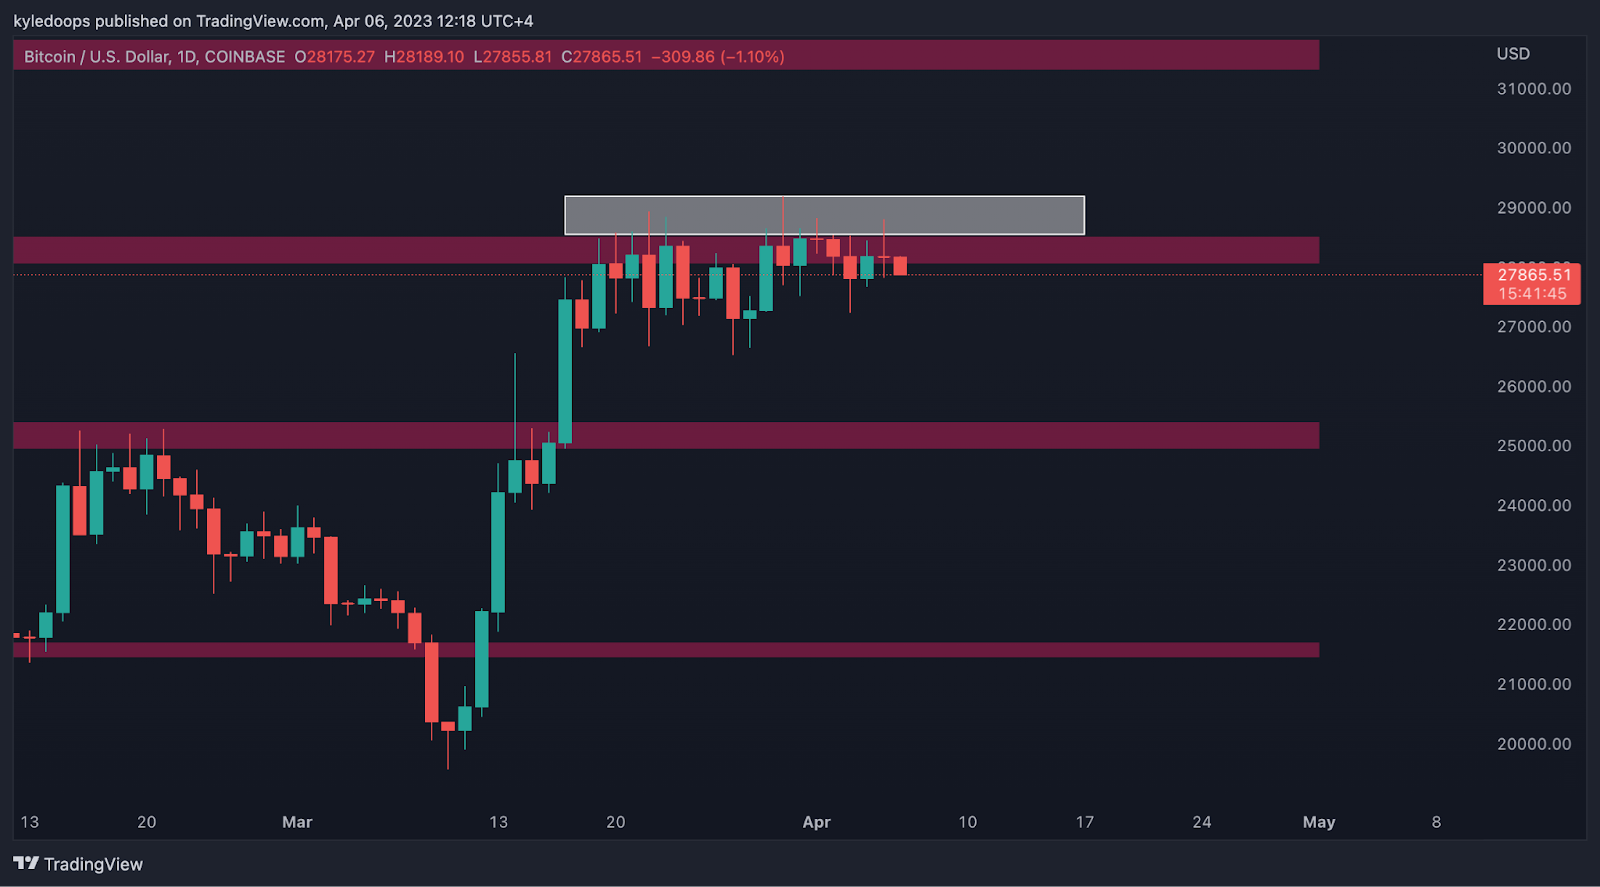
Chart #3 - Bitcoin (BTCUSD) 1-Day Chart
Chartist: Kyle
(For the chart screenshot, click here.)
Bitcoin has failed to reclaim the key level above.
As you can see, the price has been capped at the gray box area, as it continues to get rejected from there. Specifically, the zone is between $28,500 - $29,200.
There is no doubt that that region now contains a lot of liquidity, and liquidity tends to get tested. But it looks like bitcoin may start pulling back first, which could make additional room for a high momentum sprint that results in a push upwards and a breach of the $29,000 level (resistance).
For now, lower support levels are $27,200 and $25,500.
Claim your Bitget sign-up bonuses here (details below).
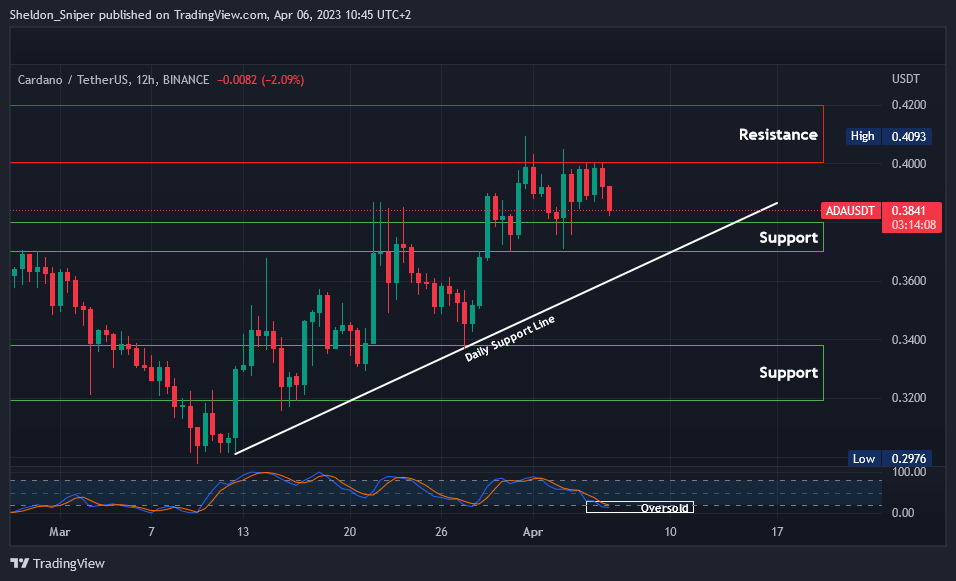
Chart #4 - Cardano (ADAUSDT) 12-Hour Chart
Chartist: Sheldon
(For the chart screenshot, click here.)
Yesterday ADA got rejected at $0.40 (resistance) and has started to retrace. It will possibly now test its next support at $0.37 - $0.38.
With its indicators on the 4HR, 8HR, and 12HR charts oversold though, we may see a bounce at that support.
Claim your Bitget sign-up bonuses here (details below).
Chart #5 - Bitcoin Fear and Greed Index
The Bitcoin Fear and Greed Index is sitting at 63 today, indicating Greed.
The highest the index has been over the past seven days is 63, and the lowest is 61.


Sniper School kicks off a new cohort on April 10th! What is Sniper School? Free 3-week trading course with Sheldon. You will learn how to trade like a pro in 3 short weeks and capitalize on the change in the markets.
There are only 3k seats and the waitlist is filling up fast! We still have some spots left for those that complete the entrance requirements of signing up for a fee exchange account and funding it. You’ll use it to trade live during the course.
The course includes weekly live workshops hosted by Sheldon, Mama Sniper, and special guests, plus daily live trading and market analysis sessions with our team of Sniper Mentors!
It’s not just a school. It really is the start of an incredible journey with our family of degens! Reserve your spot now by clicking here.
Overall Market Sentiment (Banter’s Take)
Bitcoin is consolidating into an incredibly tight range. The weekly chart has created a rare tri-star doji pattern, which shows extreme indecision and could possibly even lead to a change in market direction.
Once we see expansion from the tight range we will have a better idea as to which way to trade. Currently, the odds are stacked almost equally between bulls and bears with regard to which way the price breaks next.
Stay safe my friends!
Go to our Crypto Banter Discord here where Sheldon and Kyle give updates on the charts and trades from The Daily Candle newsletter!
Bybit winner - 47005858