

📈📉 Bitcoin PUMPS! It NEEDS to Close Above THIS Level!
📈📉 Bitcoin PUMPS! It NEEDS to Close Above THIS Level!
PLUS: SOL heading into resistance. Can it BREAK through?
Overview
Chart #1 - Crypto Total Market Cap (TOTAL) Daily
Chart #2 - Solana (SOLUSDT) Daily
Chart #3 - Solana to Ethereum Ratio (SOLETH) Daily
Chart #4 - S&P 500 (SPX) Daily
Chart #5 - Fear and Greed Index

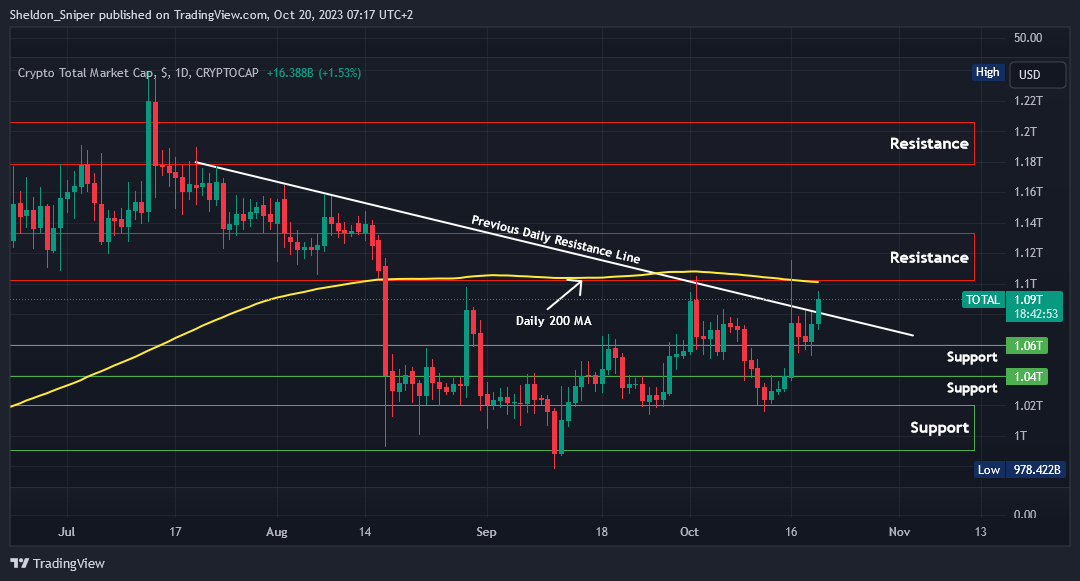
Chart #1 - Crypto Total Market Cap (TOTAL) Daily
Chartist: Sheldon
(For the chart screenshot, click here.)
The TOTAL is currently attempting to break through the descending resistance line that originates from mid-July.
Currently at $1.09T, I’m now looking for the daily candle to close above the breakout point at around $1.08T. It has major resistance overhead, with both the daily 200 Moving Average and the $1.1T level acting as resistance. This is an area that has been tested three times over the last two months.
The current move in the market could be bullish for the alts over the next few days, which have been on a slow bleed to the downside over the last few weeks.
Sign-up and trade on Bybit today.
Exclusive $30,000 deposit rewards and bonuses up for grabs!
Chart #2 - Solana (SOLUSDT) Daily
Chartist: Kyle

(For the chart screenshot, click here.)
SOL is coming straight into resistance at $27.
There is a real possibility that it breaks through, but the question is: will it hold? The prior attempt led to a deviation back into the range and went down to $17.40.
If it consolidates above, then the price may be flipping prior resistance into support.
Claim your Bitget sign-up bonuses here (details below).
Chart #3 - Solana to Ethereum Ratio (SOLETH) Daily
Chartist: Kyle

(For the chart screenshot, click here.)
SOL is pushing into the range high on the SOL/ETH chart, similar to the USD pair.
Until such time as it closes above this yellow line and consolidates, there is a real chance of a deviation back into the range.
The 0.01641 SOLETH level is the level to break and hold above. That is the line in the sand.
Claim your Bitget sign-up bonuses here (details below).
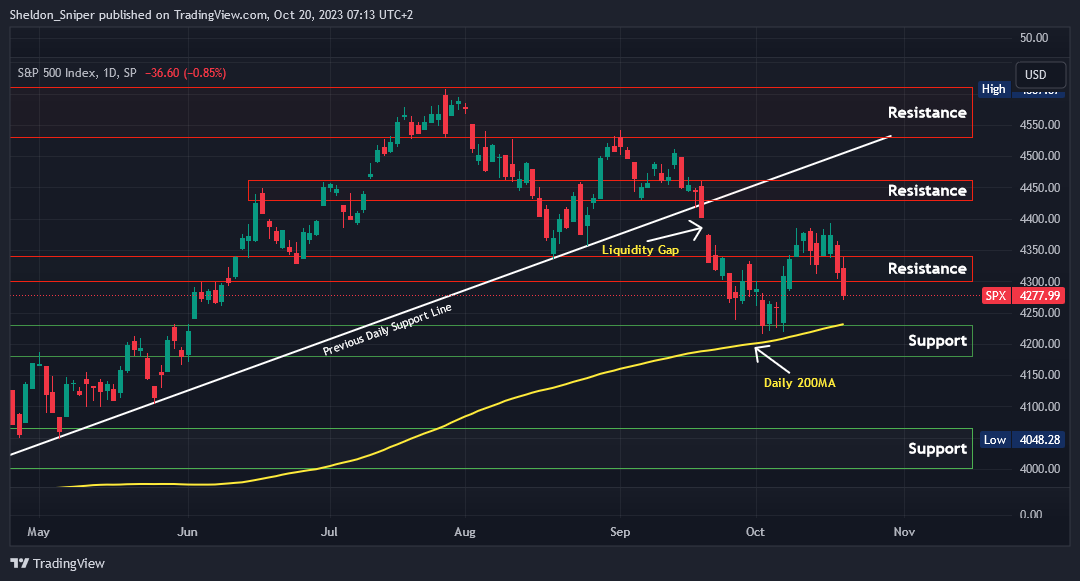
Chart #4 - S&P 500 (SPX) Daily
Chartist: Sheldon
(For the chart screenshot, click here.)
On Tuesday, the SPX got rejected at 4,400 and over the last two days has retraced all the way down to 4,278.
The 4,300 – 4,345 support zone was also broken; this area will now be acting as the next overhead area of resistance. The next level of support is at 4,240.
Crypto and US stocks do not seem to be aligned at the moment, but it's a good idea to keep an eye on the SPX chart, as further major downside could pull crypto down with it.
Claim your Bitget sign-up bonuses here (details below).
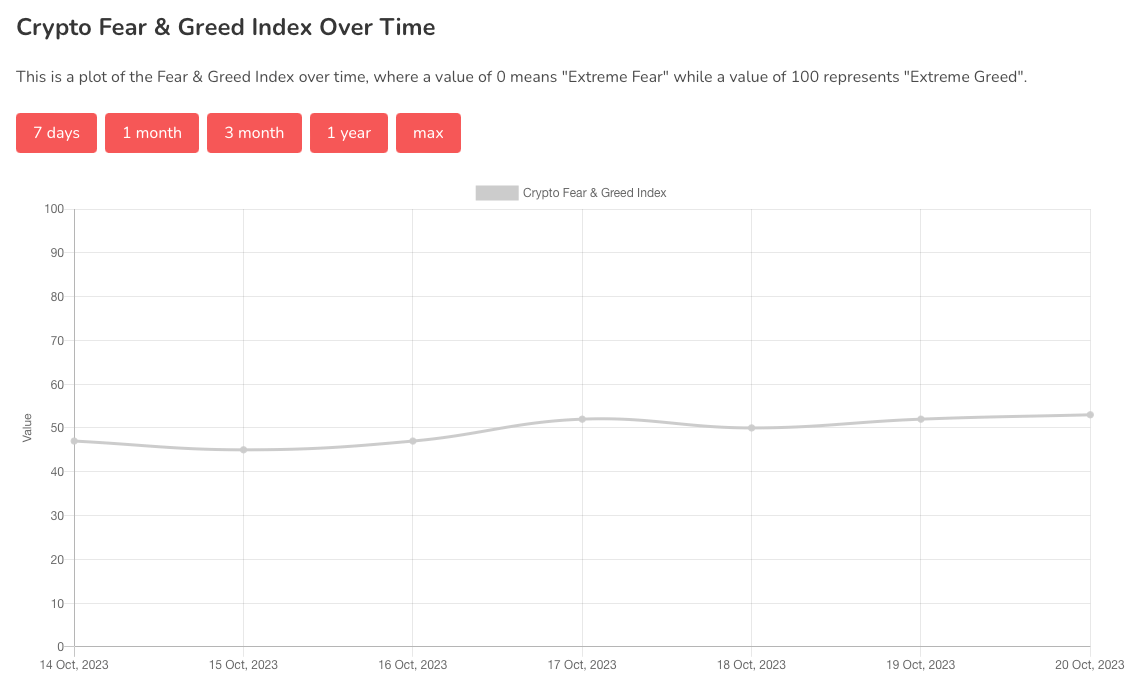
Chart #5 - Fear and Greed Index
The Fear and Greed Index is sitting at 53 today, Neutral.
The highest the index has been over the past seven days is 53, and the lowest is 45.
Banter’s Take
If Bitcoin begins to close above $30,500, prospects will improve. A monthly close at this level would establish a higher macro low.
Stay safe my friends!
Go to our Crypto Banter Discord here where Sheldon and Kyle give updates on the charts and trades from The Daily Candle newsletter!