

📈📉 BNB Could Crash the Market! Watch THIS Level!
📈📉 BNB Could Crash the Market! Watch THIS Level!

Overview
Chart #1 - Optimism (OPUSDT) 12-Hour Chart
Chart #2 - Bitcoin (BTCUSD) 1-Day Chart
Chart #3 - BNB (BNBUSDT) 1-Day Chart
Chart #4 - Polkadot (DOTUSDT) 1-Day Chart
Chart #5 - Bitcoin Fear and Greed Index

Real Vision membership packages help you understand the complex world of crypto and macro, with real in-depth analysis!
Get your membership package 👉 here, and benefit from SPECIAL Crypto Banter discounted prices!
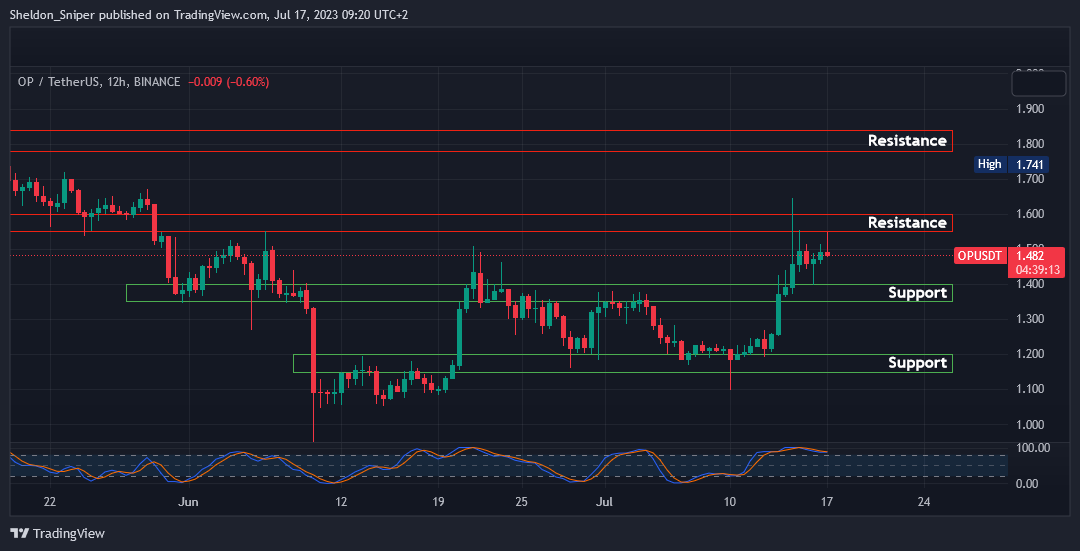
Chart #1 - Optimism (OPUSDT) 12-Hour Chart
Chartist: Sheldon
(For the chart screenshot, click here.)
OP rallied by over 35% at the end of last week, going from around $1.20 up to $1.65 before encountering resistance.
The price is currently at $1.48, and there is potential for more retracement to test the next support area at $1.35 - $1.40. This could provide an entry point for a long trade up to $1.55 - $1.60, and subsequently at $1.78 - $1.85.
OP was trading at around $3 in March and I believe it has significant upside potential in the coming weeks.
Sign-up and trade on Bybit today.
Exclusive $30,000 deposit rewards and bonuses up for grabs!
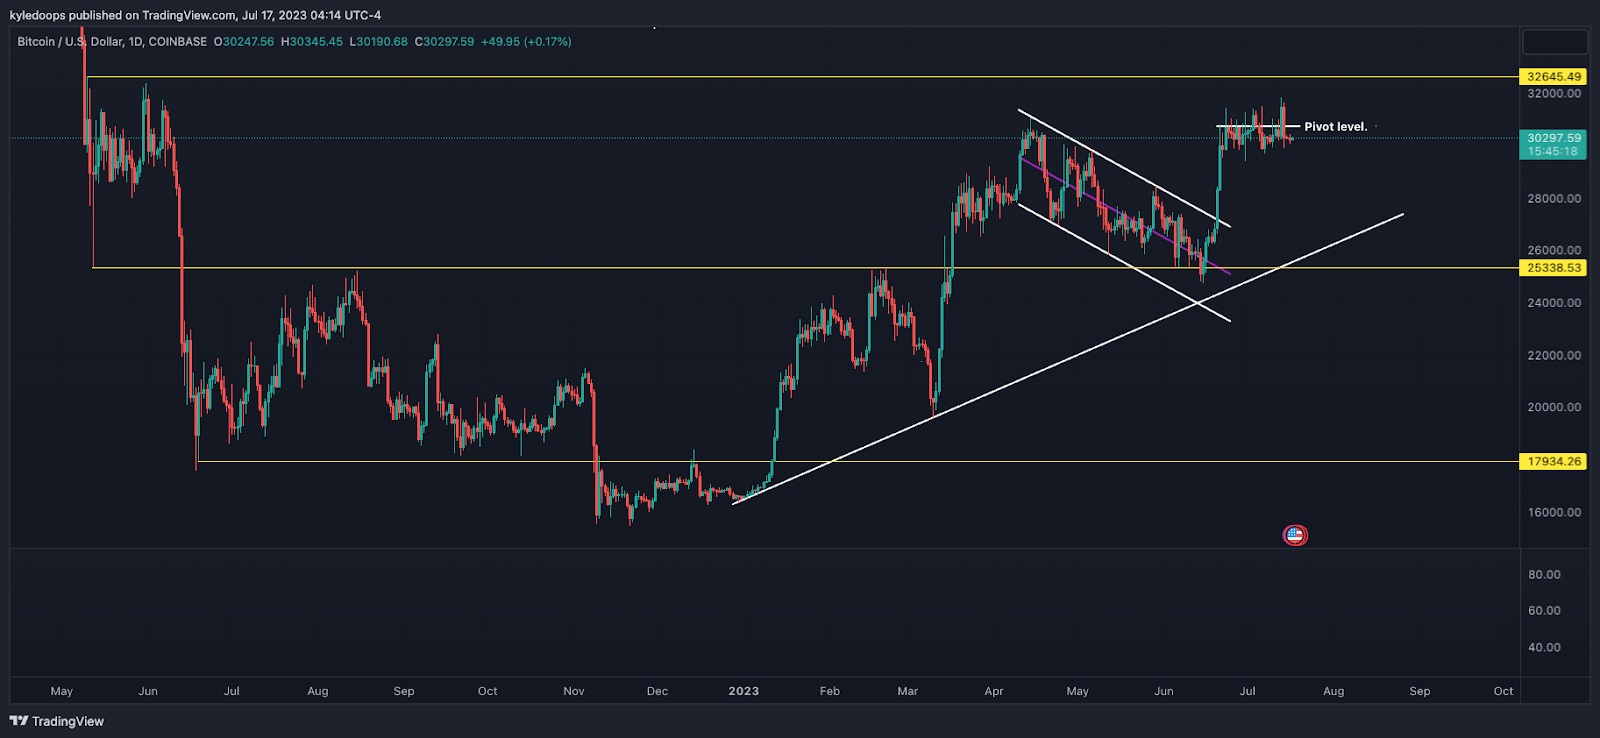
Chart #2 - Bitcoin (BTCUSD) 1-Day Chart
Chartist: Kyle
(For the chart screenshot, click here.)
BTC is nearing the range highs, although it has yet to reach the exact top.
The ultimate range high stands at $32,645. Bitcoin remains in a bull flag, consolidating following a substantial move. If this pattern plays out, it would take it above the range high level.
Today's pivot level is $30,744. This is the level Bitcoin needs to surpass for the RSI to regain strength and momentum, swinging back to the upside.
𝗣𝗿𝗶𝗺𝗲 𝗫𝗕𝗧
Sign up for a new Trading Account on Prime XBT!
Receive a deposit bonus of up to $7,000 with promo code: KyleDoops

Sign up for a new Trading Account on Prime XBT!
Receive a deposit bonus of up to $7,000 with promo code: SheldonSniper
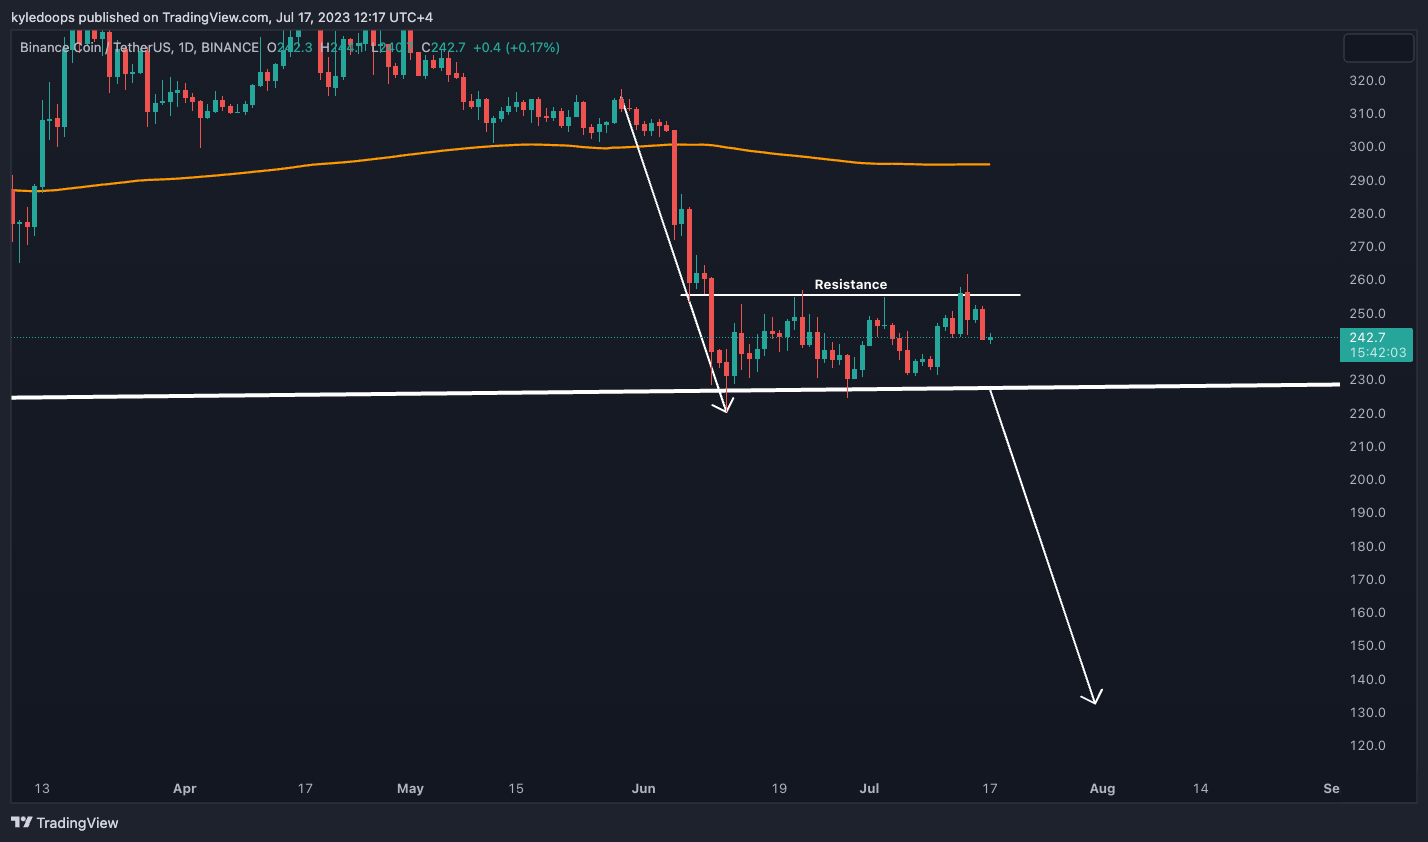
Chart #3 - BNB (BNBUSDT) 1-Day Chart
Chartist: Kyle
(For the chart screenshot, click here.)
BNB remains in a pronounced downtrend, with the price having now confirmed another swing failure pattern below $255.
A break and close below $225 will affirm the breakdown and could send BNB down to $132. This continues to be crypto's most significant risk at present.
If it breaks down, it's likely to pull much of the market down with it.
Claim your Bitget sign-up bonuses here (details below).
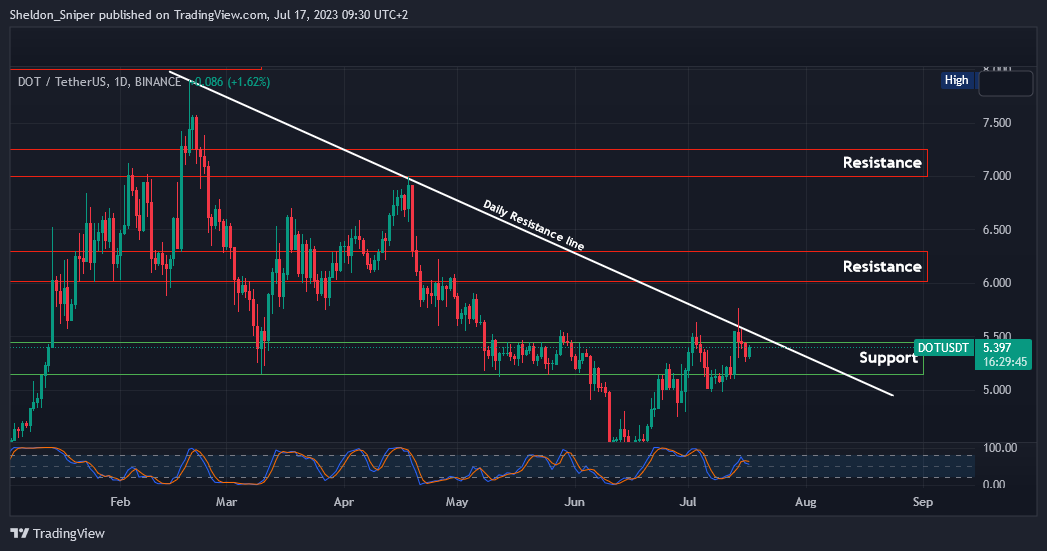
Chart #4 - Polkadot (DOTUSDT) 1-Day Chart
Chartist: Sheldon
(For the chart screenshot, click here.)
DOT is consolidating in the $5.25 - $5.50 support area after reaching a monthly high of $5.70.
If the price finds support here, I believe that in the upcoming days, DOT will try to breach the daily descending resistance line from February, and the next resistance area at $6.25 - $6.50.
Claim your Bitget sign-up bonuses here (details below).
Chart #5 - Bitcoin Fear and Greed Index
The Bitcoin Fear and Greed Index is sitting at 54 today, Neutral.
The highest the index has been over the past seven days is 64, and the lowest is 54.

Banter’s Take
Bitcoin is giving up some dominance and it's moving into various altcoins, which is what's causing multiple coins to bounce. We need to be quick on catching these bounces because they are short lived and profits are moved quickly into the next coin.
Stay safe my friends!
Go to our Crypto Banter Discord here where Sheldon and Kyle give updates on the charts and trades from The Daily Candle newsletter!