

📈📉 Brace Yourselves: CPI Chaos Incoming?
📈📉 Brace Yourselves: CPI Chaos Incoming?

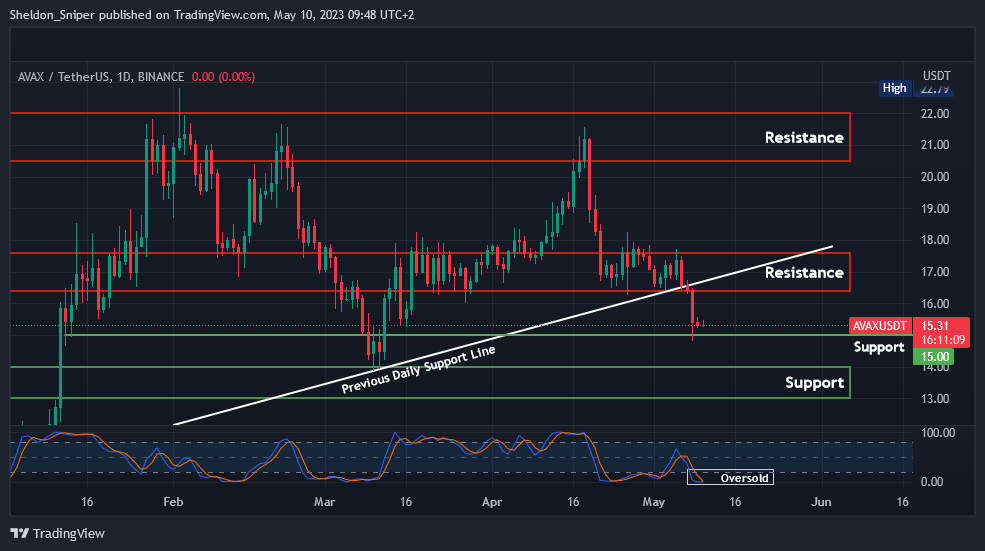
Chart #1 - Avalanche (AVAXUSDT) 1-Day Chart
Chartist: Sheldon
(For the chart screenshot, click here.)
On Saturday, AVAX broke through the $16.50 - $17.50 support area and lost its crucial daily ascending support line originating from early January. The price has declined by almost 17% over the past week, and AVAX has currently found support at around $15.00. The price is oversold across all timeframes, so we may get a trend reversal.
If the $15.00 support fails to hold, the next significant support area for AVAX lies between $13.00 - $14.00.
𝗣𝗿𝗶𝗺𝗲 𝗫𝗕𝗧
Sign up for a new Trading Account on Prime XBT!
Receive a deposit bonus of up to $7,000 with promo code: SheldonSniper
Chart #2 - Bitcoin (BTCUSD) 1-Day Chart
Chartist: Kyle

(For the chart screenshot, click here.)
Bitcoin is currently facing resistance below the daily pivot level of $28,306, which coincides with the 12 and 24-day exponential moving averages (EMAs) that are crossing downward, adding further resistance.
A rally to this level might indicate a short squeeze, causing short traders to exit their positions. However, this is likely to result in a lower high. If the price surpasses the EMAs and the pivot level, the Relative Strength Index (RSI) may begin to rise, and the $27,500 level could have been a shakeout.
If the downward trend continues, the next significant support level is at $25,000.
𝗣𝗿𝗶𝗺𝗲 𝗫𝗕𝗧
Sign up for a new Trading Account on Prime XBT!
Receive a deposit bonus of up to $7,000 with promo code: KyleDoops
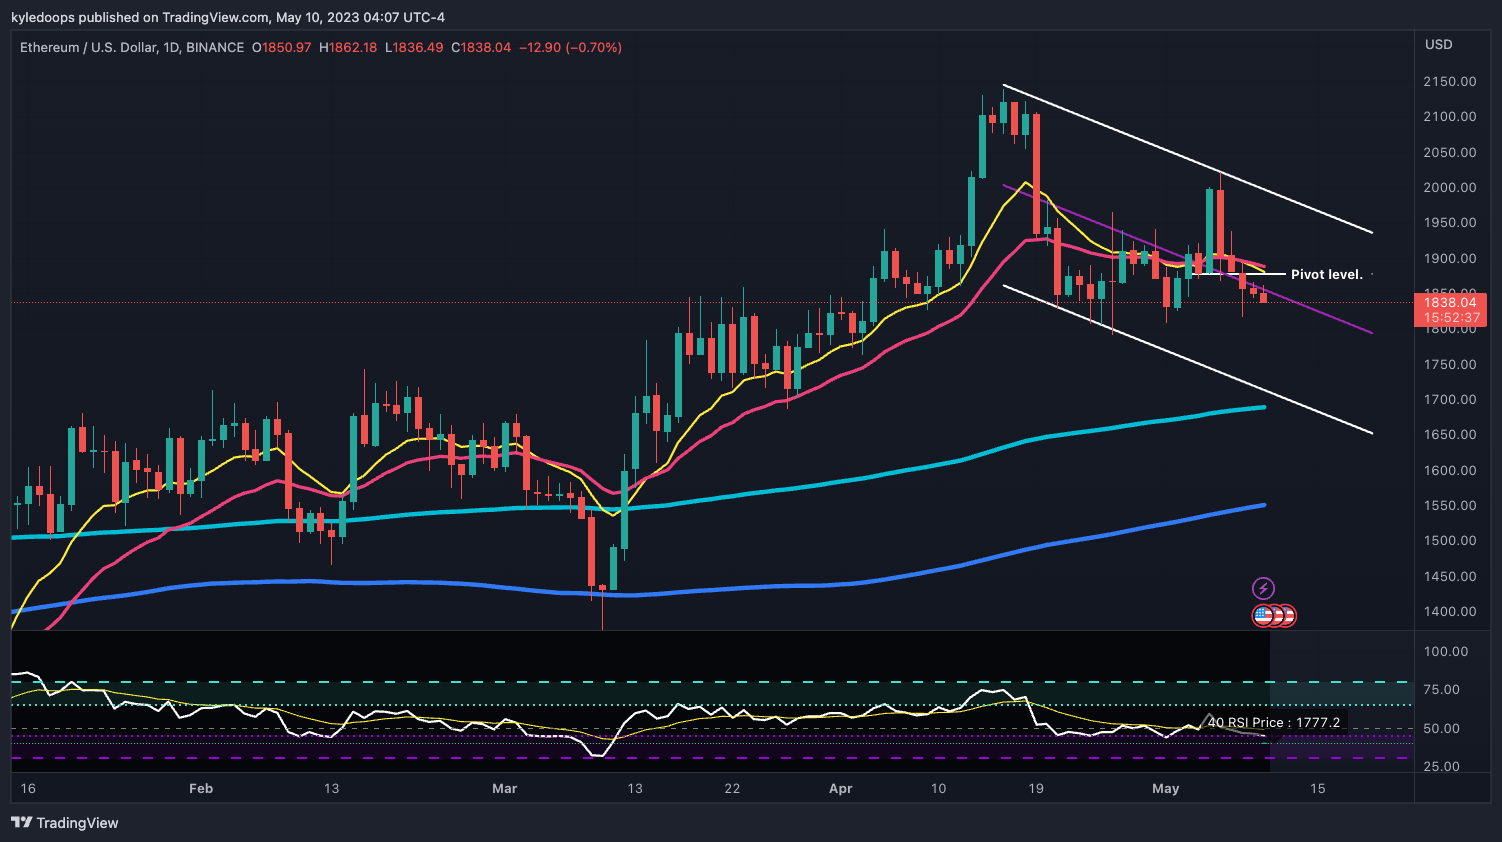
Chart #3 - Ethereum (ETHUSD) 1-Day Chart
Chartist: Kyle
(For the chart screenshot, click here.)
The ETH daily chart is quite similar to bitcoin's above, with its 12 and 24-day EMAs crossing downward and the price being stuck below the pivot level of $1,877.
If the price manages to rise above that level, the RSI will likely cross back up, shifting the momentum upward. However, as long as the price remains below the pivot level, there will be downward pressure, with the next target being $1,720 for ETH.
Claim your Bitget sign-up bonuses here (details below).
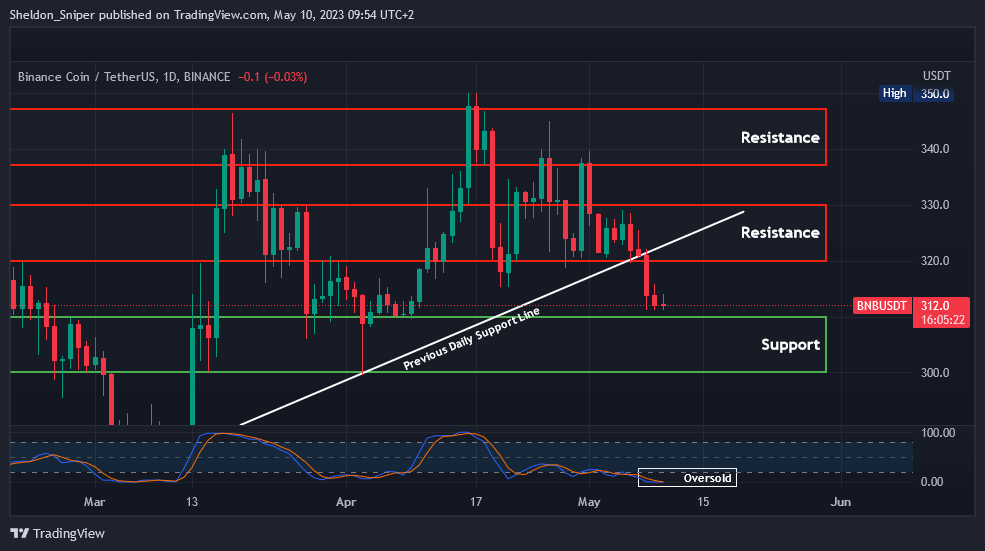
Chart #4 - BNB (BNBUSDT) 1-Day Chart
Chartist: Sheldon
(For the chart screenshot, click here.)
Over the past week, BNB has retraced along with the rest of the market.
The price, which was trading just below $330 a week ago, has since declined to $312.00 and broken the daily support line from early April.
BNB could test $320 - $325 next, where the previous daily support line was. If the price drops below $310, BNB could potentially head towards the bottom of the current range support, which is at the crucial $300 level.
Claim your Bitget sign-up bonuses here (details below).
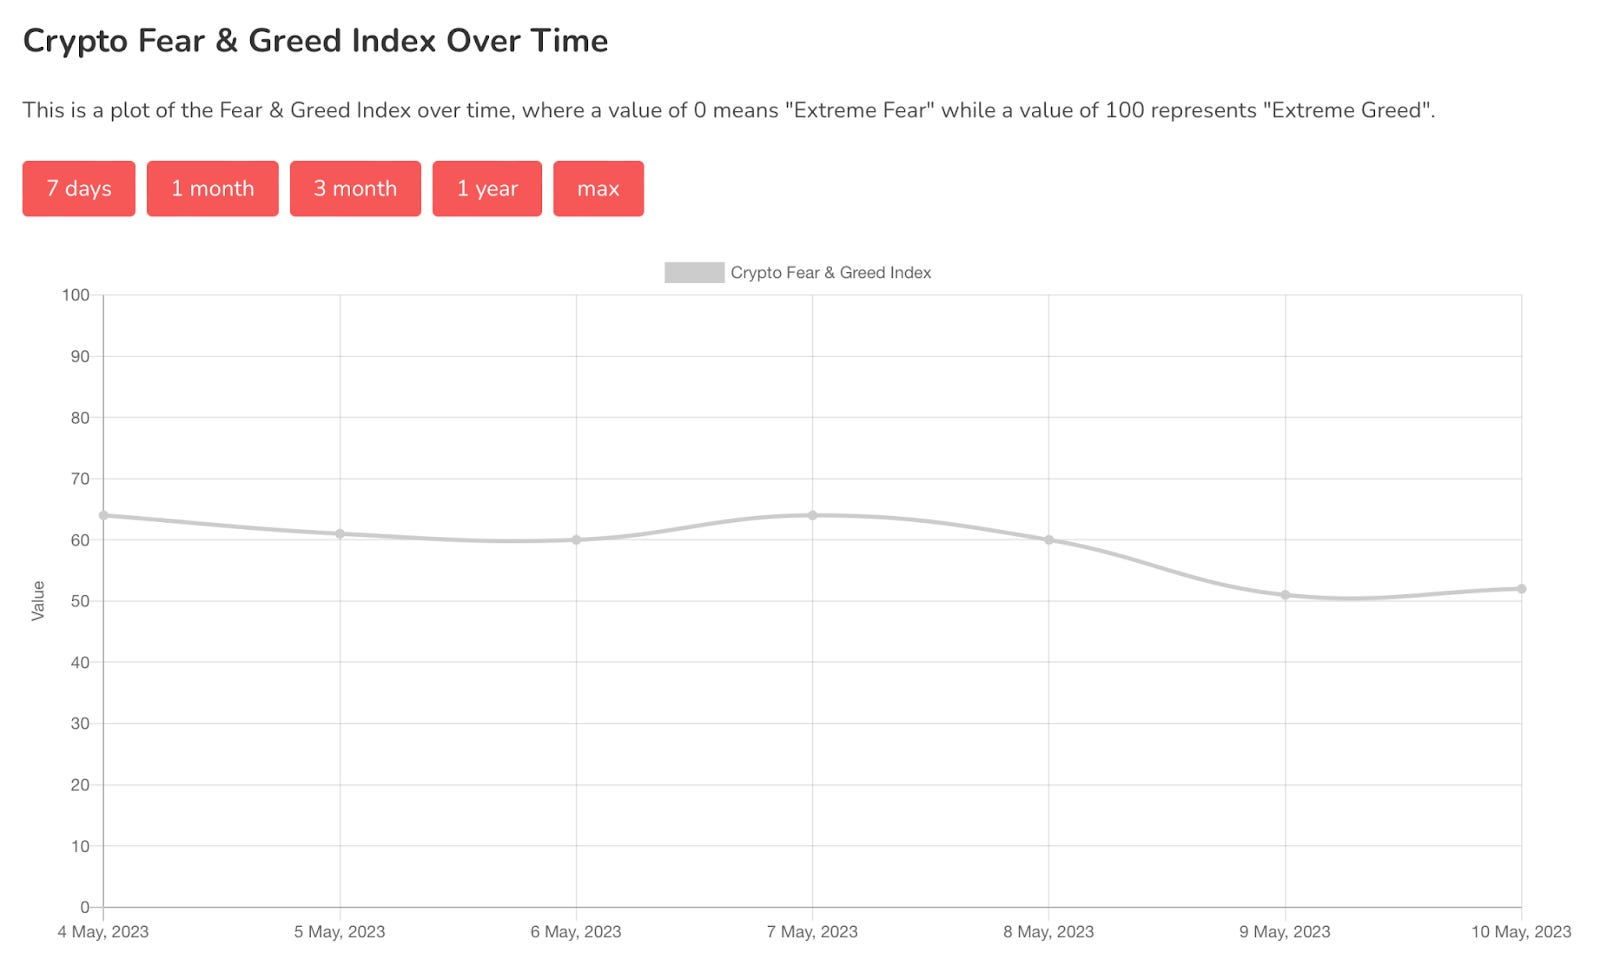
Chart #5 - Bitcoin Fear and Greed Index
The Bitcoin Fear and Greed Index is sitting at 52 today, Neutral.
The highest the index has been over the past seven days is 64, and the lowest is 51.

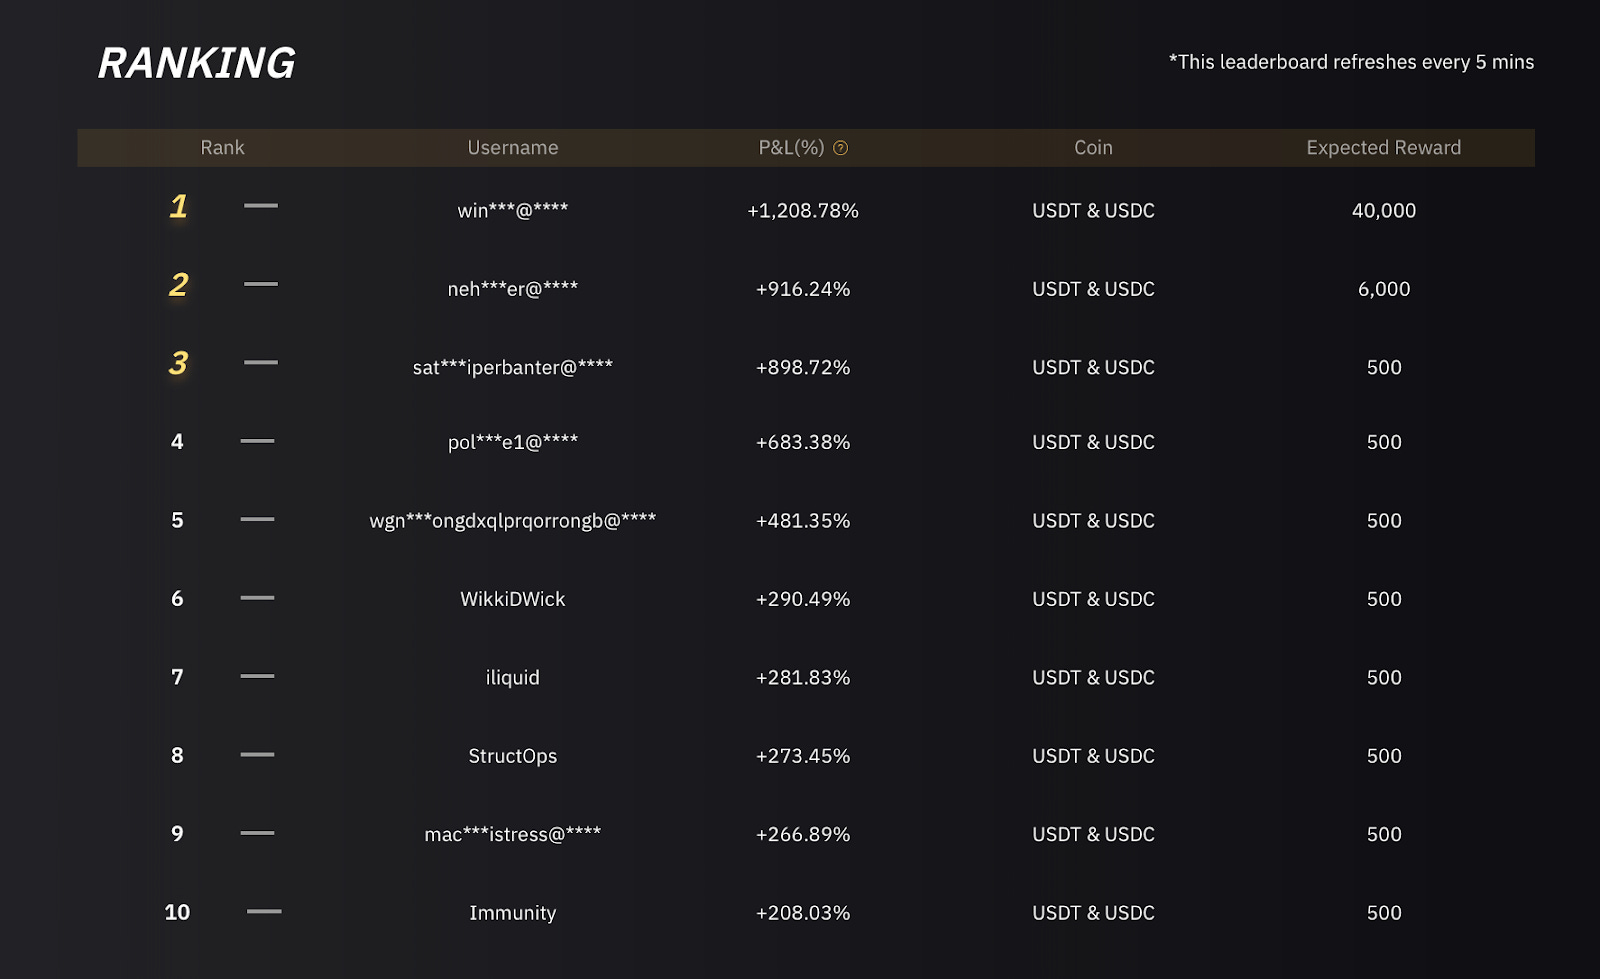
➡️ ENTER THE COMPETITION HERE ⬅️
Banter’s Take
Despite the state of the charts looking terrible and many coins making new lows, there is still a possibility of a quick squeeze to the upside, due to the negative funding rates which indicate leverage traders are chasing price down into support.
But the shorts will likely reload after being squeezed.
Stay safe my friends!
Go to our Crypto Banter Discord here where Sheldon and Kyle give updates on the charts and trades from The Daily Candle newsletter!
Today’s winning UIDs:
Bybit winner - 26906260
Bitget winner - 4043144064