

📈📉 BTC and ETH Falling! Major Trade Opportunities!
📈📉 BTC and ETH Falling! Major Trade Opportunities!

Overview
Chart #1 - S&P 500 (SPX) Daily Chart
Chart #2 - Ethereum (ETHUSD) Hourly Chart
Chart #3 - Bitcoin (BTCUSD) Hourly Chart
Chart #4 - Solana (SOLUSDT) Daily Chart
Chart #5 - Fear and Greed Index

Chart #1 - S&P 500 (SPX) Daily Chart
Chartist: Sheldon

(For the chart screenshot, click here.)
On Friday, the SPX faced rejection at 4,540. And over the past three days, it has retraced to the next support level around 4,440. This retracement is partly due to both the DXY & US 10YR Yield rising.
The rejection on Friday has resulted in a lower high, indicating bearishness. Although the SPX remains overbought on the daily time frame, if it can find support at its current level, there might be a reversal of trend, potentially pushing it back to test the next resistance level near 4,500.
If the 4,430 - 4,460 support zone fails, the subsequent support can be found at the ascending daily support line, which dates back to the end of March, around the 4,400 mark. Should the SPX and the broader US stock market continue their downward trend, crypto could also be dragged down.
𝗣𝗿𝗶𝗺𝗲 𝗫𝗕𝗧
Sign up for a new Trading Account on Prime XBT!
Receive a deposit bonus of up to $7,000 with promo code: SheldonSniper
Sign-up and trade on Bybit today.
Exclusive $30,000 deposit rewards and bonuses up for grabs!
Chart #2 - Ethereum (ETHUSD) Hourly Chart
Chartist: Kyle

(For the chart screenshot, click here.)
Most retail traders would look at this supporting trend line and think it's a great buy.
However, professional traders will be eyeing below that level for a major liquidity zone. The price will eventually wipe out all those stops and trend down to the $1,530 level, where it could potentially bounce.
The high timeframe's major liquidity for ETH is at the $1,400 level. So, short-term traders can anticipate a quick bounce from $1,530, while long-term traders should watch for major support at $1,400.
𝗣𝗿𝗶𝗺𝗲 𝗫𝗕𝗧
Sign up for a new Trading Account on Prime XBT!
Receive a deposit bonus of up to $7,000 with promo code: KyleDoops
Chart #3 - Bitcoin (BTCUSD) Hourly Chart
Chartist: Kyle
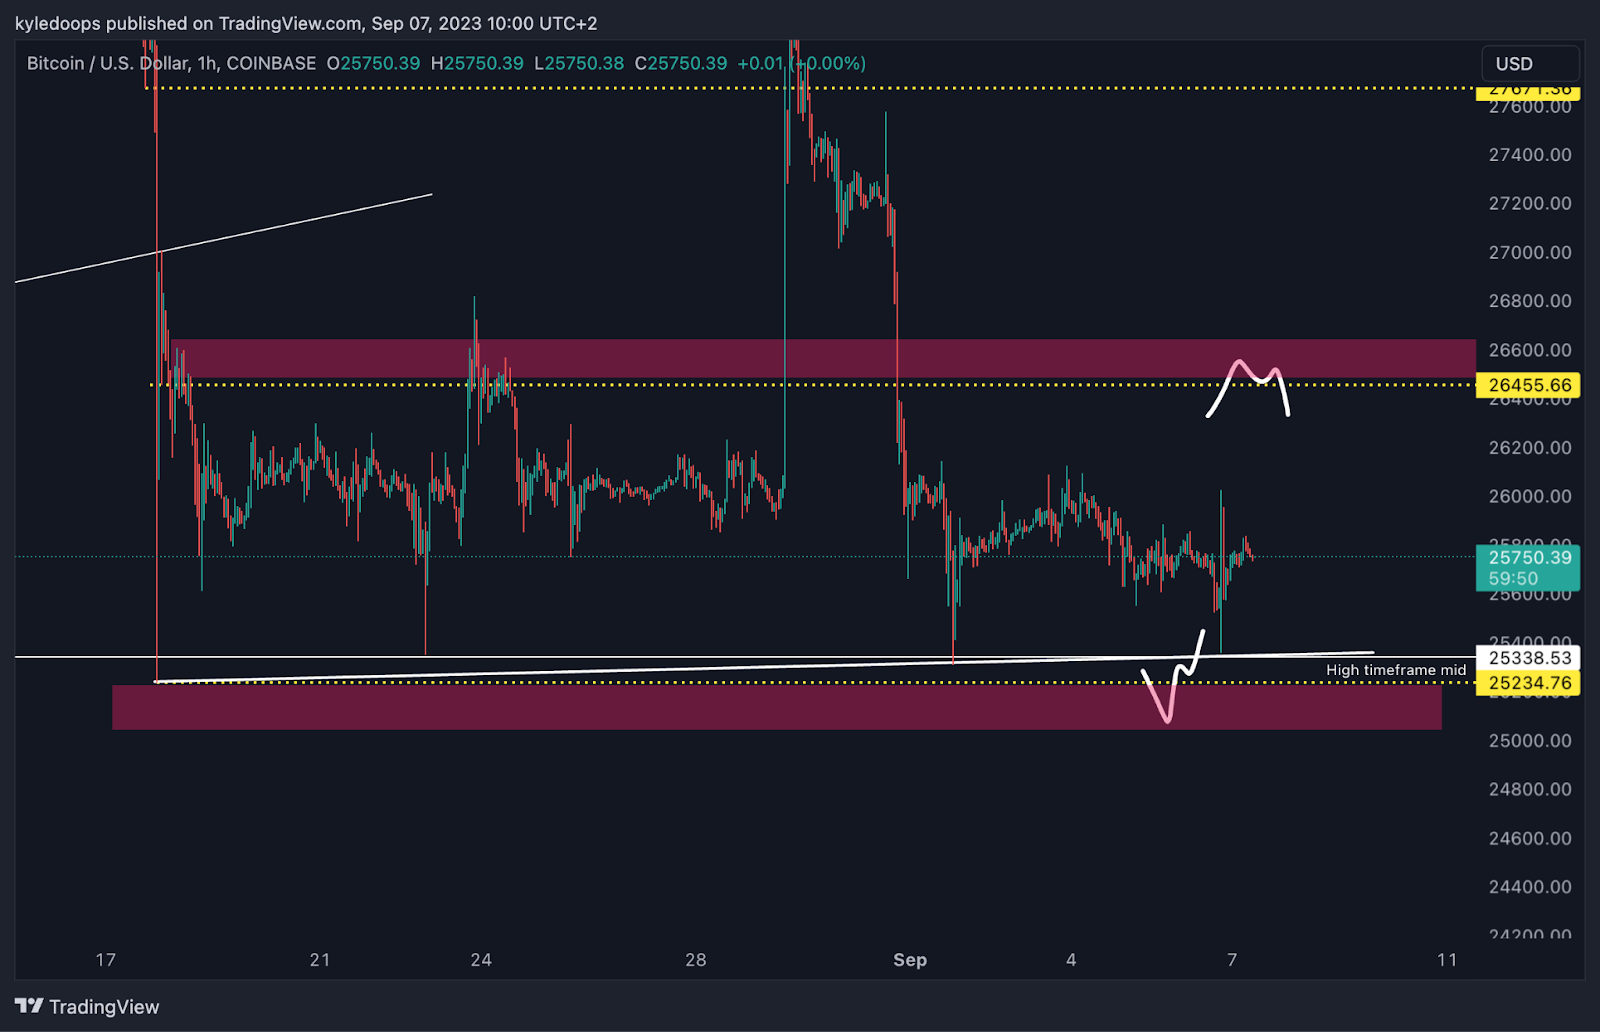
(For the chart screenshot, click here.)
Similar to ETH, retail traders will view the white trend line as support and buy every time it hits that level.
That means that liquidity is building below, so the price could sweep down to the $25,000 level. If it does so and returns to the range, then target $26,600.
However, if it hits $26,500 first, then watch for a sell-off back to $25,000.
Claim your Bitget sign-up bonuses here (details below).
Chart #4 - Solana (SOLUSDT) Daily Chart
Chartist: Sheldon
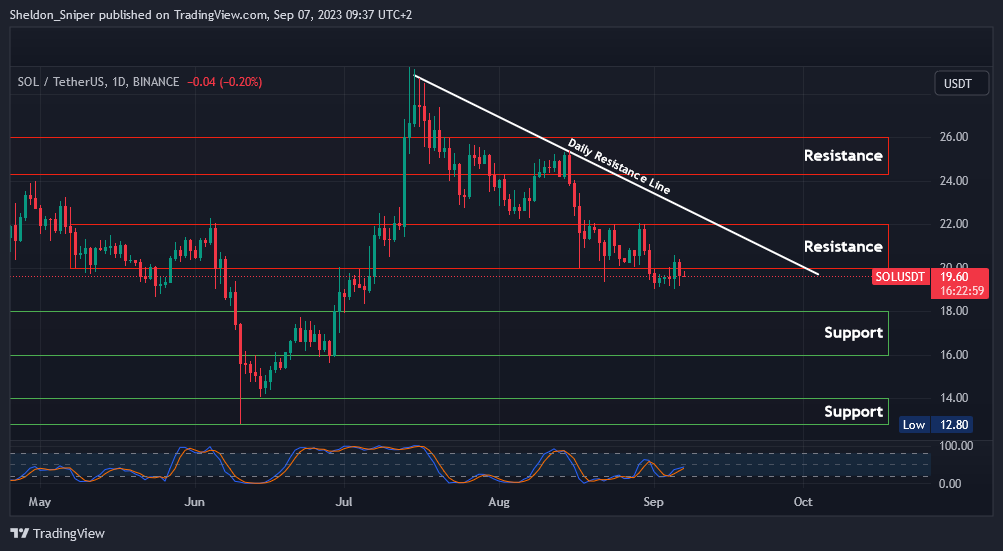
(For the chart screenshot, click here.)
SOL is trading within a narrow range, with support at $19.00 and resistance at $20.00.
If it can breach $20.00 and successfully turn it into support, it will make its way to $22.00.
But, if $19.00 is lost, the next support zone lies between $16.00 - $18.00.
Claim your Bitget sign-up bonuses here (details below).
Chart #5 - Fear and Greed Index
The Fear and Greed Index is sitting at 41 today, indicating Fear.
The highest the index has been over the past seven days is 42, and the lowest is 39.

Banter’s Take
There's a lot of excitement around the filings for ETH spot ETFs. However, now might not be the time to give in to FOMO. It's best to wait for a proper test of the $1,400 level on ETH.
Stay safe my friends!
Go to our Crypto Banter Discord here where Sheldon and Kyle give updates on the charts and trades from The Daily Candle newsletter!