

📈📉 BTC Bearish! It MUST Close HERE to Turn BULLISH!
📈📉 BTC Bearish! It MUST Close HERE to Turn BULLISH!
A potential strategy is to go long once BTC reclaims THIS EMA!
Overview
Chart #1 - Nakamoto Games (NAKAUSDT) Daily
Chart #2 - Bitcoin (BTCUSD) Weekly
Chart #3 - Bitcoin Dominance (BTC.D) Weekly
Chart #4 - S&P 500 (SPX) Daily
Chart #5 - Fear and Greed Index

Chart #1 - Nakamoto Games (NAKAUSDT) Daily
Chartist: Sheldon
(For the chart screenshot, click here.)
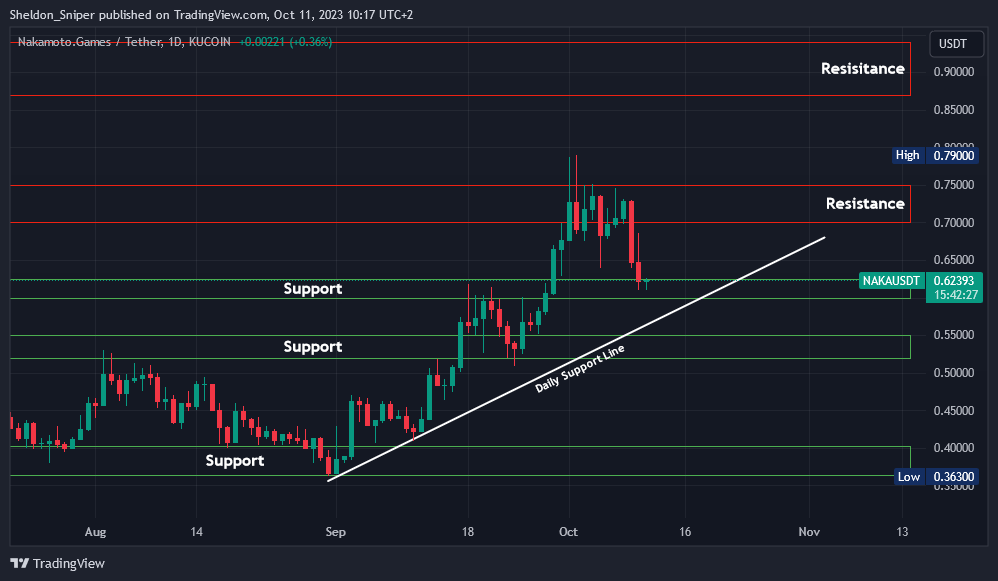
In the past six weeks, NAKA surged from approximately $0.36 to a recent high of $0.79 last week. It then faced resistance in the $0.70 - $0.75 range.
The price has retraced to the subsequent support zone between $0.60 and $0.625. If this range sustains as support, I believe the price could retest the $0.70 - $0.75 resistance zone or even approach the next resistance between $0.87 and $0.95.
If the present support fails, NAKA could head to $0.57.
Sign-up and trade on Bybit today.
Exclusive $30,000 deposit rewards and bonuses up for grabs!
Chart #2 - Bitcoin (BTCUSD) Weekly
Chartist: Kyle
(For the chart screenshot, click here.)
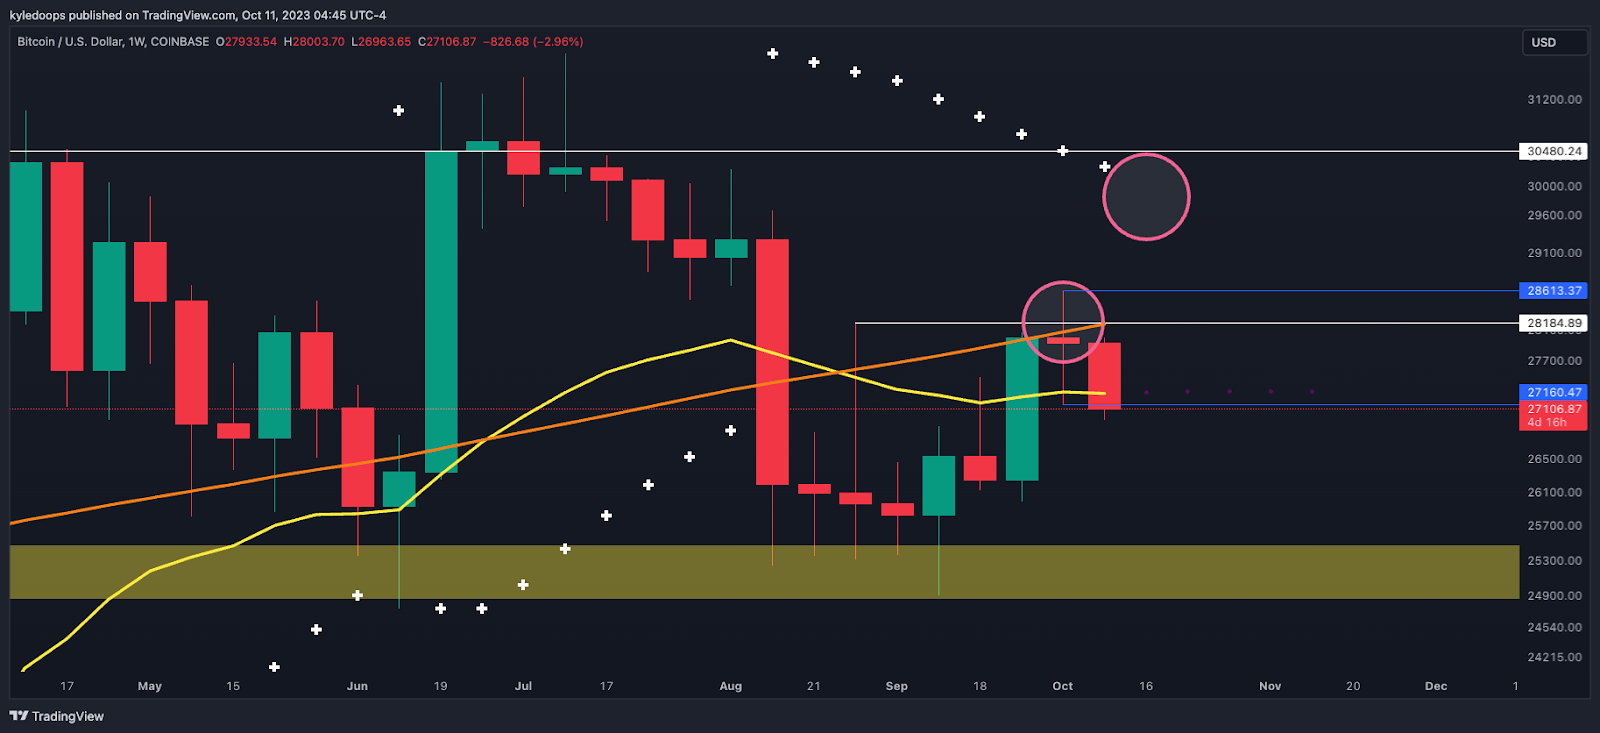
Bitcoin is currently facing resistance at the 200-week moving average, suggesting an overall downside risk, particularly as it's below the lucid SARs, which add to the resistance.
For aggressive traders, a potential strategy is to go long once Bitcoin reclaims the yellow 21 EMA.
On the other hand, conservative investors might wait for a reclaim of three key areas: the 21 EMA, the 200 MA, and the lucid SAR. Thus, for a bullish stance, Bitcoin needs to surpass and sustain above the $30,000 mark.
Claim your Bitget sign-up bonuses here (details below).
Chart #3 - Bitcoin Dominance (BTC.D) Weekly
Chartist: Kyle
(For the chart screenshot, click here.)
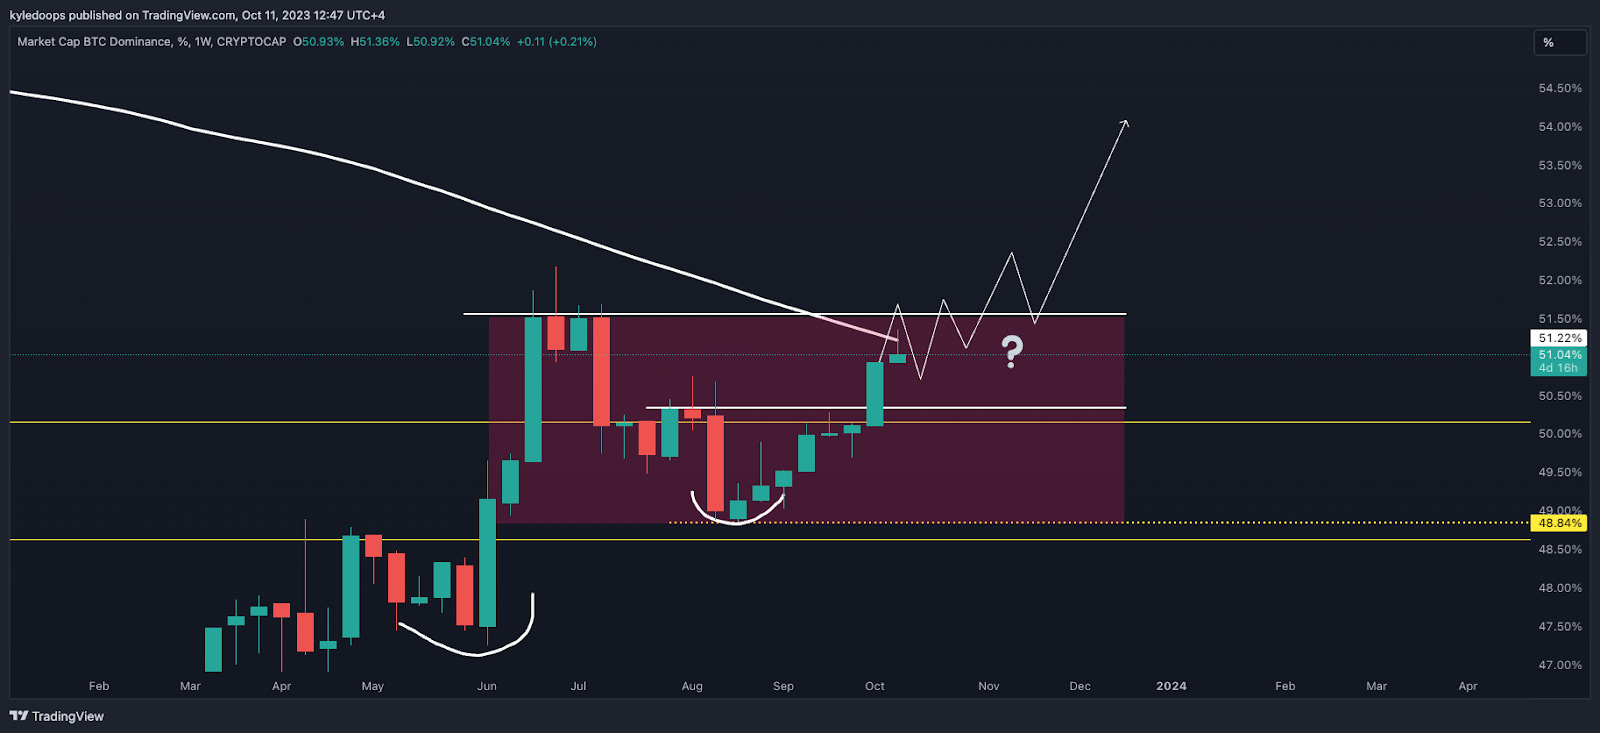
Risk leans towards the upside, suggesting a higher dominance is probable.
Dominance is currently consolidating right at the 200-week moving average. A reclaim of this MA, coupled with a break above the prior swing high at 51.50%, would confirm the breakout.
However, if there's a rejection and subsequent pullback from this level, keep an eye out for a higher low. This might indicate that the breakout will take more time to materialize.
Claim your Bitget sign-up bonuses here (details below).
Chart #4 - S&P 500 (SPX) Daily
Chartist: Sheldon
(For the chart screenshot, click here.)
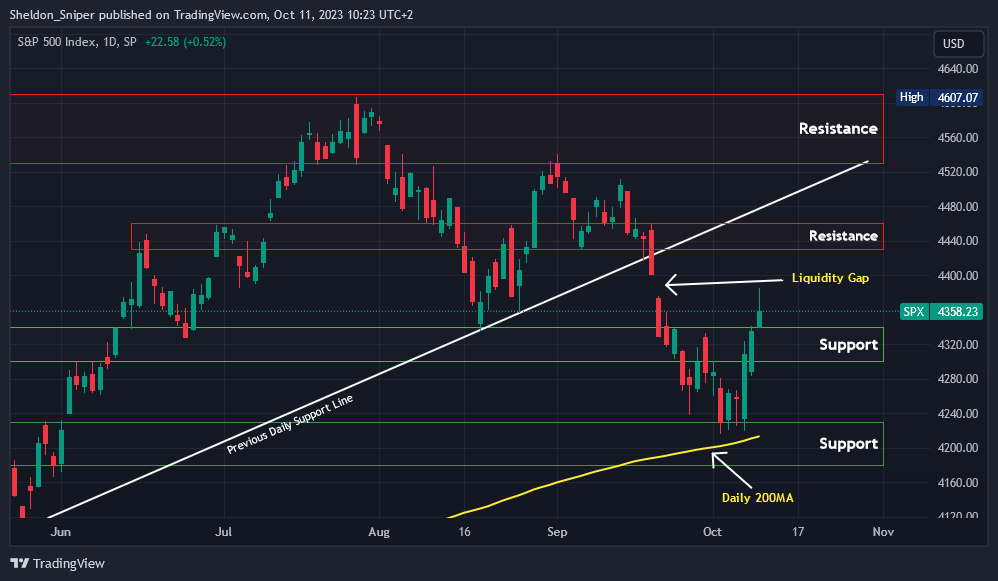
Over the past three days, the SPX has climbed from 4,220 to 4,385, currently facing resistance. The market may experience volatility in the upcoming two days due to today's PPI and tomorrow's CPI.
Yesterday, the SPX nearly closed the "liquidity gap" formed between 20th & 21st September and has since retraced to its current position at 4,358. If the price continues this pullback, the subsequent support zone lies between 4,300 and 4,325.
However, if the news in the next two days proves favorable for the market, I anticipate the SPX will extend its upward trajectory. The following resistance zone is between 4,435 and 4,460.
Claim your Bitget sign-up bonuses here (details below).
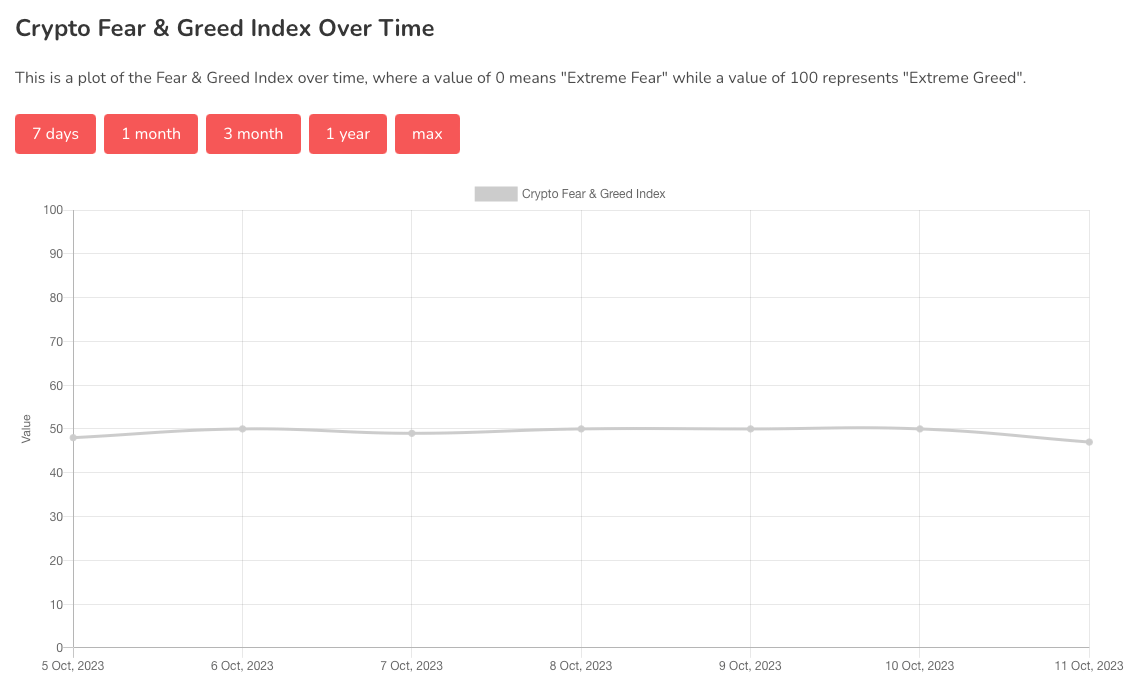
Chart #5 - Fear and Greed Index
The Fear and Greed Index is sitting at 47 today, Neutral.
The highest the index has been over the past seven days is 50, and the lowest is 47.
Banter’s Take
As long as Bitcoin remains below $27,200 on a weekly close, the risk leans towards the downside. A close above $27,200 would bolster optimism for the bulls.
Stay safe my friends!
Go to our Crypto Banter Discord here where Sheldon and Kyle give updates on the charts and trades from The Daily Candle newsletter!