

📈📉 BTC Breaks $72K! HOW HIGH Will It Go?
📈📉 BTC Breaks $72K! HOW HIGH Will It Go?
TIA About to Enter Price Discovery?
Overview
Chart #1 - Cardano (ADAUSDT) 8-Hour
Chart #2 - The Graph (GRTUSDT) 8-Hour
Chart #3 - Celestia (TIAUSDT) 8-Hour
Chart #4 - Crypto Total Market Cap (TOTAL) Weekly
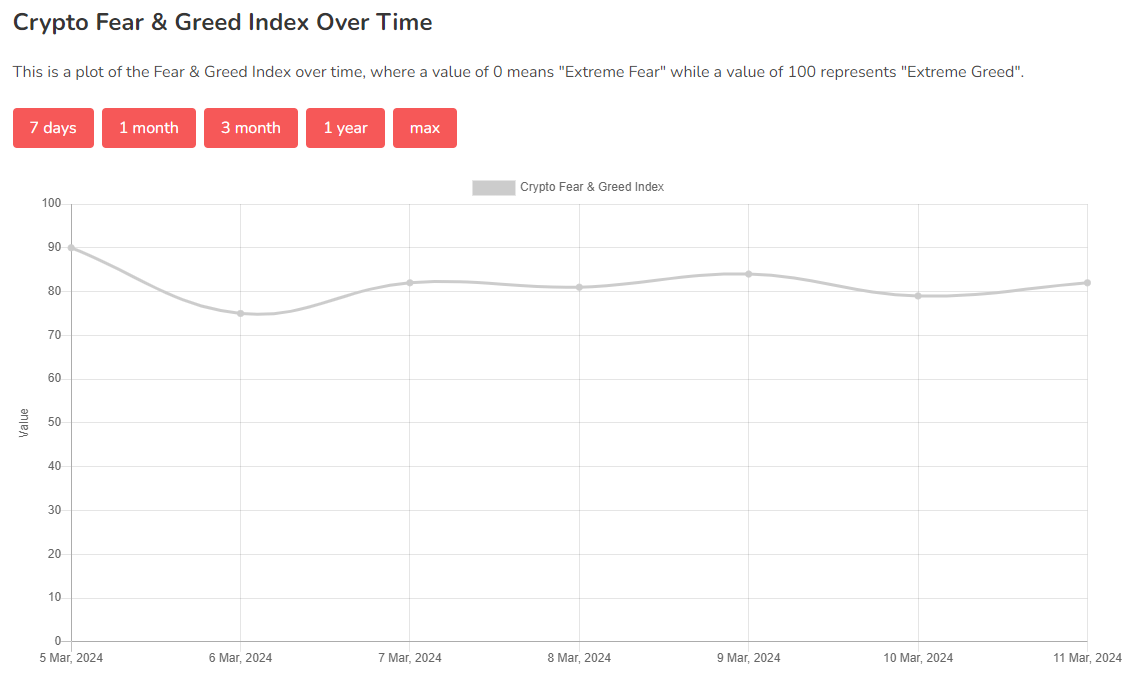
Chart #5 - Fear and Greed Index
Chart #1 - Cardano (ADAUSDT) 8-Hour
Chartist: Sheldon
(For the chart screenshot, click here.)
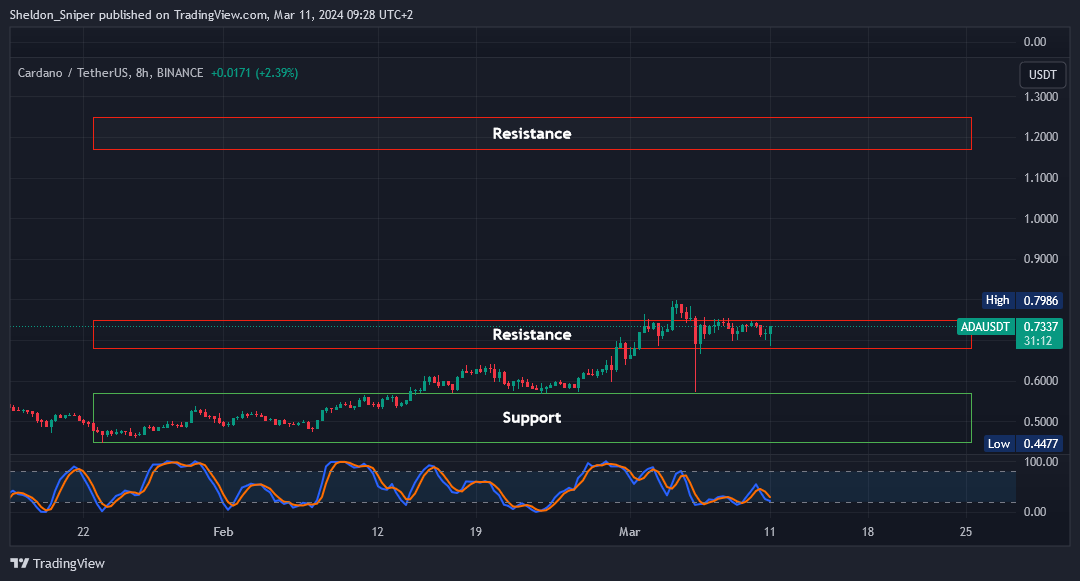
ADA has been consolidating sideways for almost two weeks, and could be getting ready for the next leg up.
I am watching the $0.75 level very closely on Bybit. A break of that level could mean a push up to the next area of resistance.
Entry: With a break of the $0.75, I will enter into a long spot trade.
Take Profit (TP): There is only one TP area at the next area of resistance at $1.18 - $1.25
Stop Loss: Just below $0.68
The market is becoming overheated, and I expect a correction soon. Traders should manage their risk closely over the next couple of days.
Chart #2 - The Graph (GRTUSDT) 8-Hour
Chartist: Kyle
(For the chart screenshot, click here.)
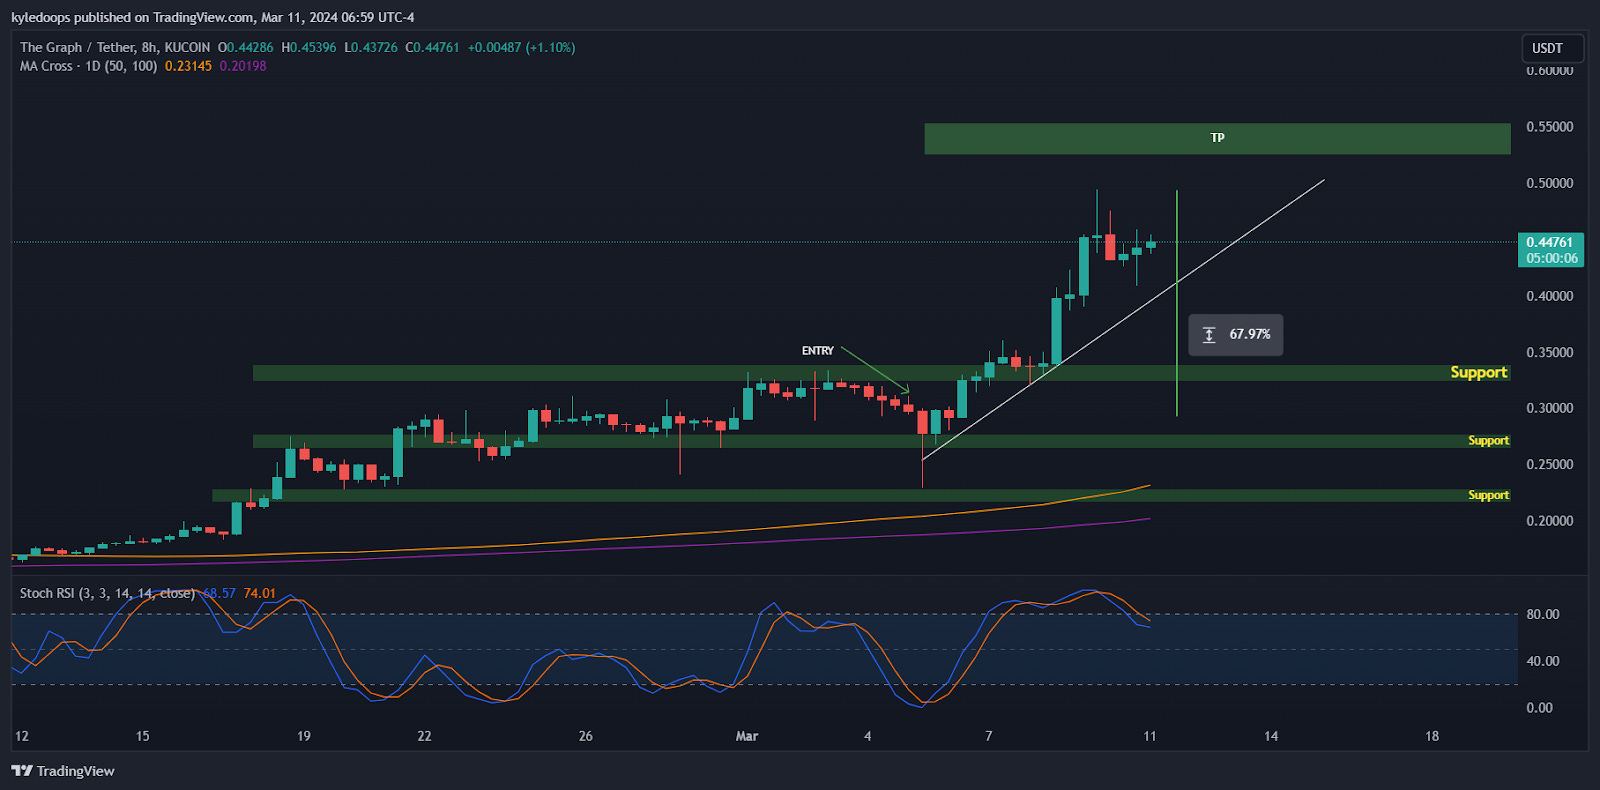
Here’s a quick update on the GRT trade given last week (Tuesday). Price held the support at $0.26 with the daily close after the liquidation candle.
We have subsequently continued the bullish momentum and GRT has moved up 67% from entry. Our clear invalidation area can now be moved to a daily close back below $0.3.
As for now we move upward and onward towards our first TP zone around $0.55.
TP targets for price on a long-term trade:
$0.55
$0.76
$1.10
Claim your Bitget sign-up bonuses here (details below).

Outsmart 99% Of The Market!
Get full access into our Discord And Telegram group, where you'll find all of our premium content!
👉 Trade Signals!
👉 Trade Set-Ups!
👉 Trading Challenges!
👉 Education!
👉 SO MUCH MORE!
Chart #3 - Celestia (TIAUSDT) 8-Hour
Chartist: Kyle
(For the chart screenshot, click here.)
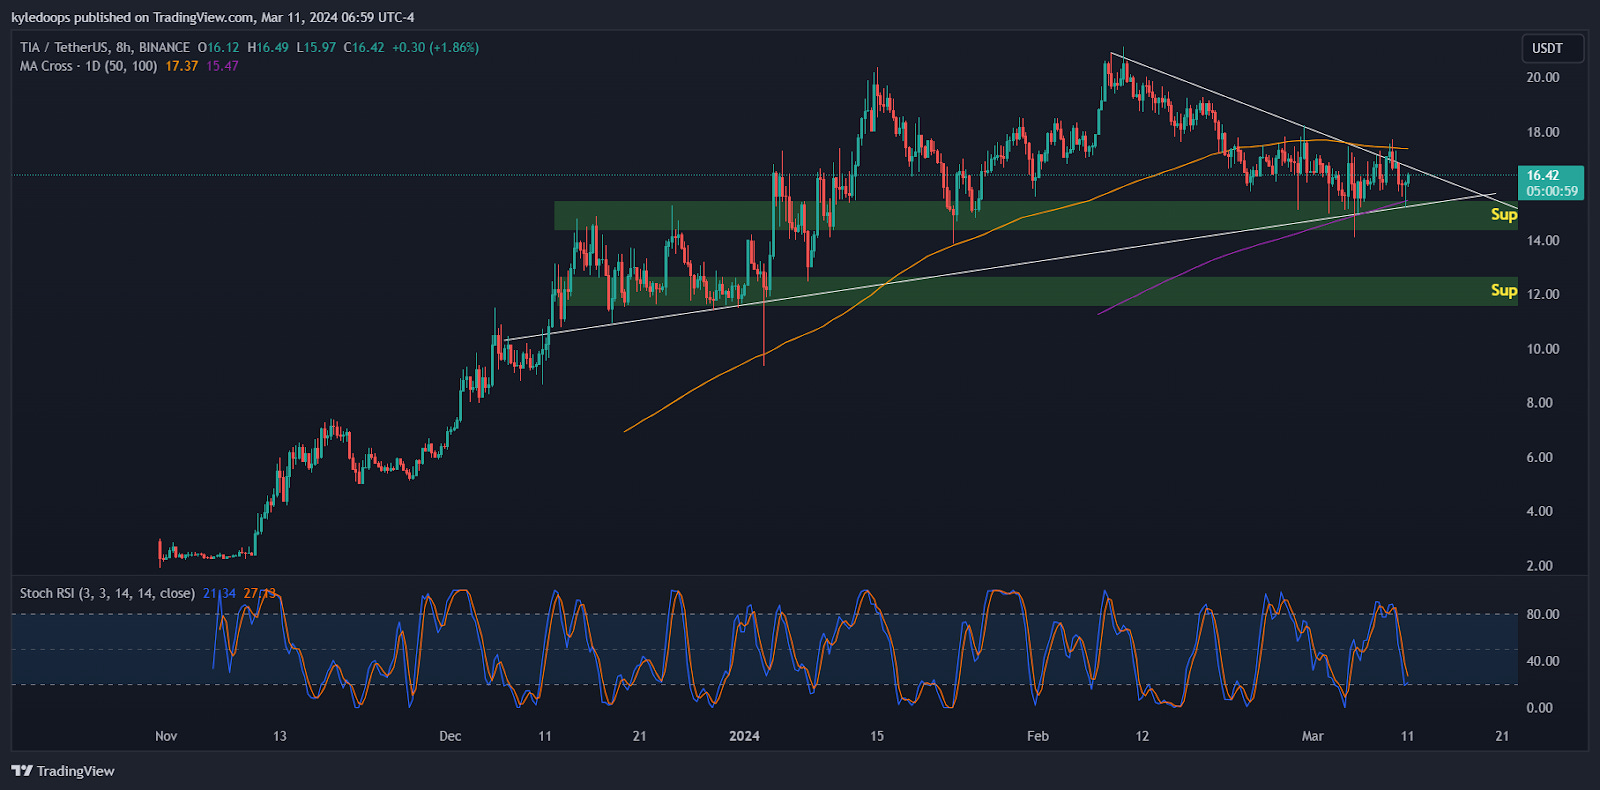
TIA looks to have flipped the previous resistance of $15 into support and is currently holding the 100 Day Moving Average (MA). With price currently trading 30% below its All-Time High (ATH) it has great potential here to enter into price discovery. I’m getting set up on Bitget.
Entry 1: Between $14 and $17.
Entry 2: I’ll look for the break and retest of the trend with price gaining acceptance above $17 to double up on entry and get a confirmation that trend is changing towards the upside.
Entry 3: On any liquidation hunt, I’ll look to add onto position at $11.50 and $8.50.
Stop Loss: Any daily closes below $14 reduce risk. I’ll cut the trade if price looses $11.
TP1: Retest of ATH at $21.
TP2: $27.
TP 3: On loss of HTF trend. We will discover it together.
Chart #4 - Crypto Total Market Cap (TOTAL) Weekly
Chartist: Sheldon
(For the chart screenshot, click here.)
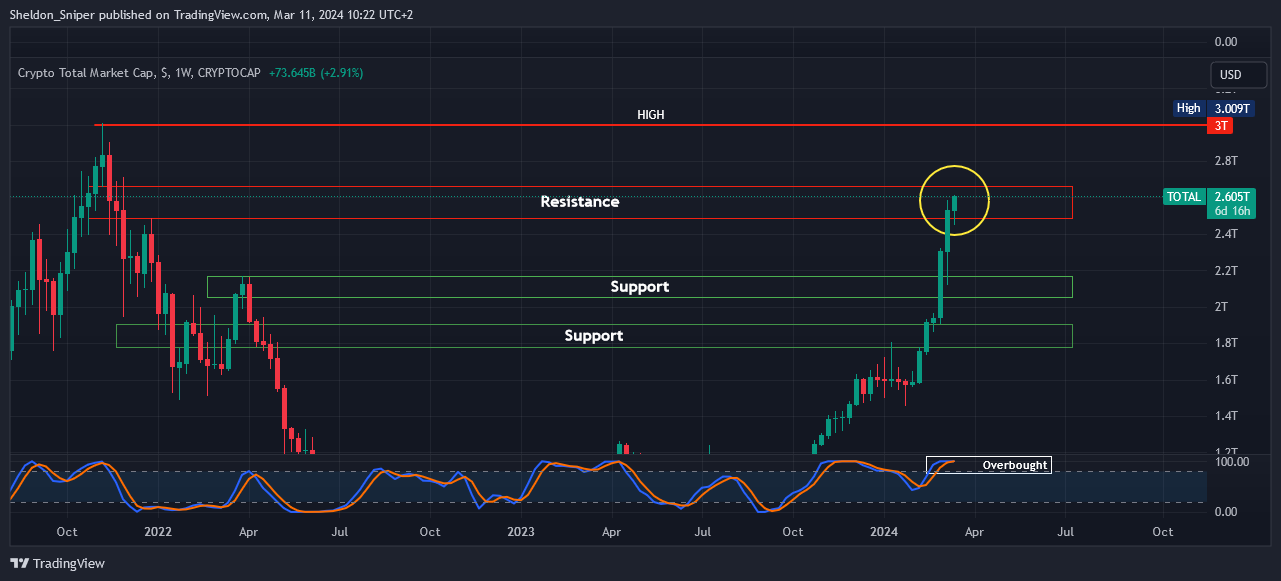
The TOTAL is at a level last seen towards the end of the last bull run.
It is currently in the $2.50T - $2.67T area of resistance, and is extremely overbought.
BTC is currently in price discovery, and we are not sure how high it is going to go, but there could be a sharp reversal at any stage, and traders need to be aware of this, and manage their risk very tightly over the next couple of days.
If the market does manage to break through the $2.67T level, the next resistance is the November 2021 all time high of $3T.
A rejection in this area, could mean a test of the next area of support at $2.05T – T2.17T.
Claim your Bitget sign-up bonuses here (details below).
Chart #5 - Fear and Greed Index
The Fear and Greed Index is sitting at 82 today, indicating Extreme Greed.
The highest the index has been over the past seven days is 90, and the lowest is 75.
Banter’s Take
Bitcoin has moved into price discovery. Consolidation in this area is super bullish. We could be seeing $78k to $85 as soon as this week.
Looking at previous cycles, a consolidation at ATH prices has led to a real parabolic move, so hold on tight to the rocket and enjoy the ride. This said we are still waiting on a 30 to 40% pullback on BTC.
The price to watch on BTC is $68k. Loosing this level would indicate a possible move back towards $55k as discussed on this morning’s show.
As we move into phase 4 of this run, take note of how money usually flows and when BTC finally finds its range to consolidate we can expect a flow from BTC into ETH, other L1s, and then further down into more high-risk lower cap tokens where major gains can be made.
Stay safe my friends!
Go to our Crypto Banter Discord here where Sheldon and Kyle give updates on the charts and trades from The Daily Candle newsletter!